

Tariff Talk Trumps Wall Street
8:00am (EST)
Wall Street was looking to cap a big comeback week as much of Friday’s action pushed higher weekly highs following last Monday’s selloff. However, late day selling pressure halted the momentum on news that President Trump would be leveling 25% tariffs on Canada, Mexico and China.
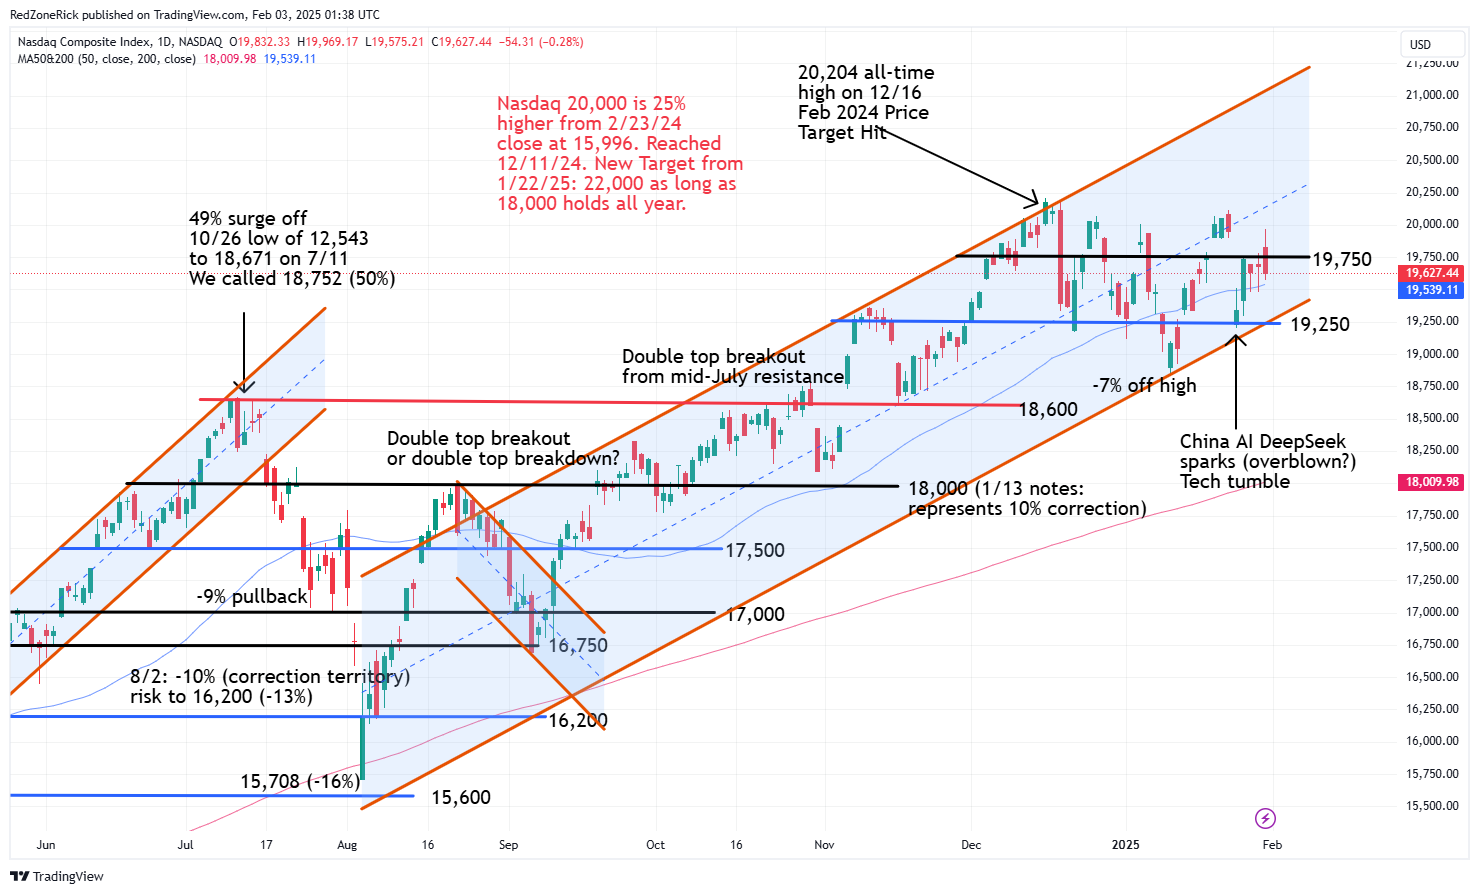
The Nasdaq traded up to 19,969 before settling lower at 19,627 (-0.3%). Resistance at 20,000 held. Support is at 19,500.
The S&P 500 finished at 6,040 (-0.5%) after testing a high of 6,120. Resistance at 6,100 held. Support is at 6,000.
The Dow peaked at 45,054 while ending at 44,544 (-0.8%). Resistance at 45,000 held. Support is at 44,500.
Earnings and Economic News
Before the open: IDEXX Laboratories (IDXX), Lavoro (LVRO), Tyson Foods (TSN)
After the close: Clorox (CLX), J&J Snack Foods (JJSF), Palantir Technologies (PLTR), Rambus (RMBS), Woodward (WWD)
Economic News
PMI Services Index – 9:45am
Construction Spending – 10:00am
ISM Manufacturing Index – 10:00am
Technical Outlook and Market Thoughts
We noted on the charts that the panic pullback last Monday over China’s AI Platform, DeepSeek, may have been a possible overreaction with the major indexes holding key support levels while rebounding the following session. Higher highs were also made throughout the week, and on Friday, before the pullback.
Tech earnings were mostly better-than-expected with a few of the heavy hitters justifying their commitment to AI spending. This helped ease concerns over the authenticity of DeepSeek’s price tag.
The Nasdaq held its uptrend channel off the early August low on Monday. An adjusted uptrend channel off the January 13th low at 18,831 doesn’t make much of a difference and now has the bottom of the channel at 19,350 instead of 19,500. There is stretch down to 19,250 with closes below this level being a warning signal for Tech stocks.
The index struggled clearing key resistance at 19,750 for three-straight sessions before making another run at 20,000 on Friday. Another move above this level gets a retest to 20,250 and the middle of the uptrend channel back in play with the December 16th record high at 20,204.
The S&P also held its previous uptrend channel from the August 5th low on Monday’s pullback and we are now going to adjust it to include the January 2nd intraday low. The current trading range between 6,000-6,100 has now been in play for the past nine sessions with the prior Friday’s all-time high at 6,128. The prior range in this zone lasted 16 sessions. Closes back above 6,100 keeps breakout potential towards 6,200-6,250 in the mix with the latter now representing the middle of the current uptrend channel.
Key support is at 6,000 and the 50-day moving average which represents the bottom of the uptrend channel. The chart still shows mid-month stretch to the 5,850 level with the January 13th bottom at 5,773. These levels will likely come into play on multiple closes back below 6,000.

The Russell regained and held key resistance at 2,300 on Thursday following Monday’s close back below this level. Friday’s peak hit 2,322 before 2,300 failed. We continue to talk about closes above 2,325 and the 50-day moving average being a better setup for the bulls.
Shaky support remains at 2,275 with backup at 2,260. A move below 2,250 and the January 15th and 16th double-bottom low at 2,252 could lead to a more severe pullback to 2,225-2,175. Some good news… the 50-day moving average flattened out on Thursday and Friday.

The Dow bucked the trend last Monday and came within 19 points of a fresh all-time on Friday with key resistance at 45,000 holding throughout the week. Continued closes above 45,000 and the December 4th all-time high at 45,073 gets 45,500-46,000 in focus.
Support is at 44,250-44,000. A drop below 43,750 and the 50-day moving average just below would imply a near-term top.

The Volatility Index (VIX) kissed an intraday low of 14.90 and was on track to possibly settle below 15. The January lows are at 14.59 in back-to-back sessions followed by 14.58. A move below 14.50 this week would be very bullish for the market.
The close back above the 50-day and 200-day moving averages to end the week was a neutral reading. Key resistance is at 17.50 followed by 20-22.50.

The action in the Dow is suggesting a possible broader rotation into other sectors. We often mention the index is overlooked as it its price weighted and only has 30 stocks but this a bullish development. They say a rising tide can lift all boats and the major indexes remain within striking distance of fresh all-time highs.
On the flip side, we also have to watch for a possible double-top in the Dow if the bulls fail to clear and hold 45,000 throughout all of this week. The index lost nearly 3,000 points in 12 sessions following the previous record high.
February has been known to be volatile but could turn out to be a surprise month if the current technical outlook holds. If the VIX clears and holds 20 for multiple sessions, there will likely be a near-term pullback in the market.
TRENDING: These 3 ‘Small Account’ Strategies CRUSHED 2024!
For years, we’ve been hearing traders as the same question… over and over again…
“How can I get started without risking it all?”
Because let’s get real for a second. Most strategies NEVER work. And when they do – they expose you to so much risk that the SECOND you hit a losing trade – you’re wiped out.
For this very reason, we have been working on a basic system that uses three types of trades.
It’s fully integrated and can take less than 20 minutes a week to nail 15%, 88% and occasionally swing for the fences with 300%.
The best part? It’s a system you can use the rest of your life.
Go here… watch this video see if you like the strategies.
(guess what? you can access them for just $5 bucks if you like what you see)