

Tech, Small-Caps Officially in Bear Market Territory
Wall Street ended the back half of the week in shock as Thursday’s overall 5% plunge in the stock market carried over into Friday’s action that resulted in another 6% pounding. The two-day losses over the tariff news pushed the major indexes into negative territory for the year and below last August lows.
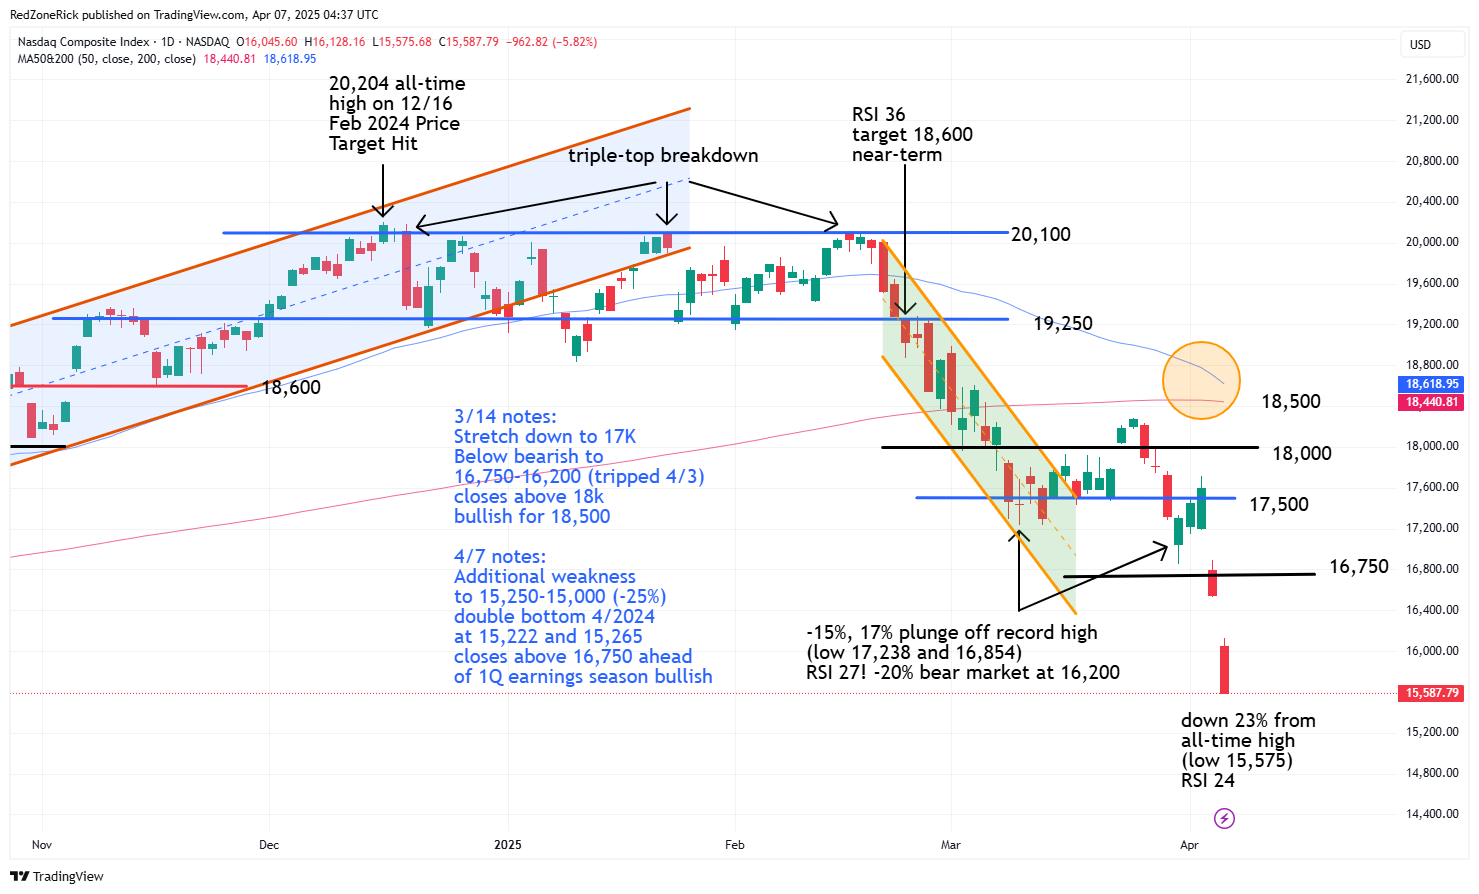
The Nasdaq ended at 15,587(-5.8%) with the intraday low kissing 15,575. Support at 15,600 failed to hold. New resistance is at 16,000.
The S&P 500 traded to a low of 5,069 before settling at 5,074 (-6%). Key support at 5,000 held. Resistance is at 5,200.
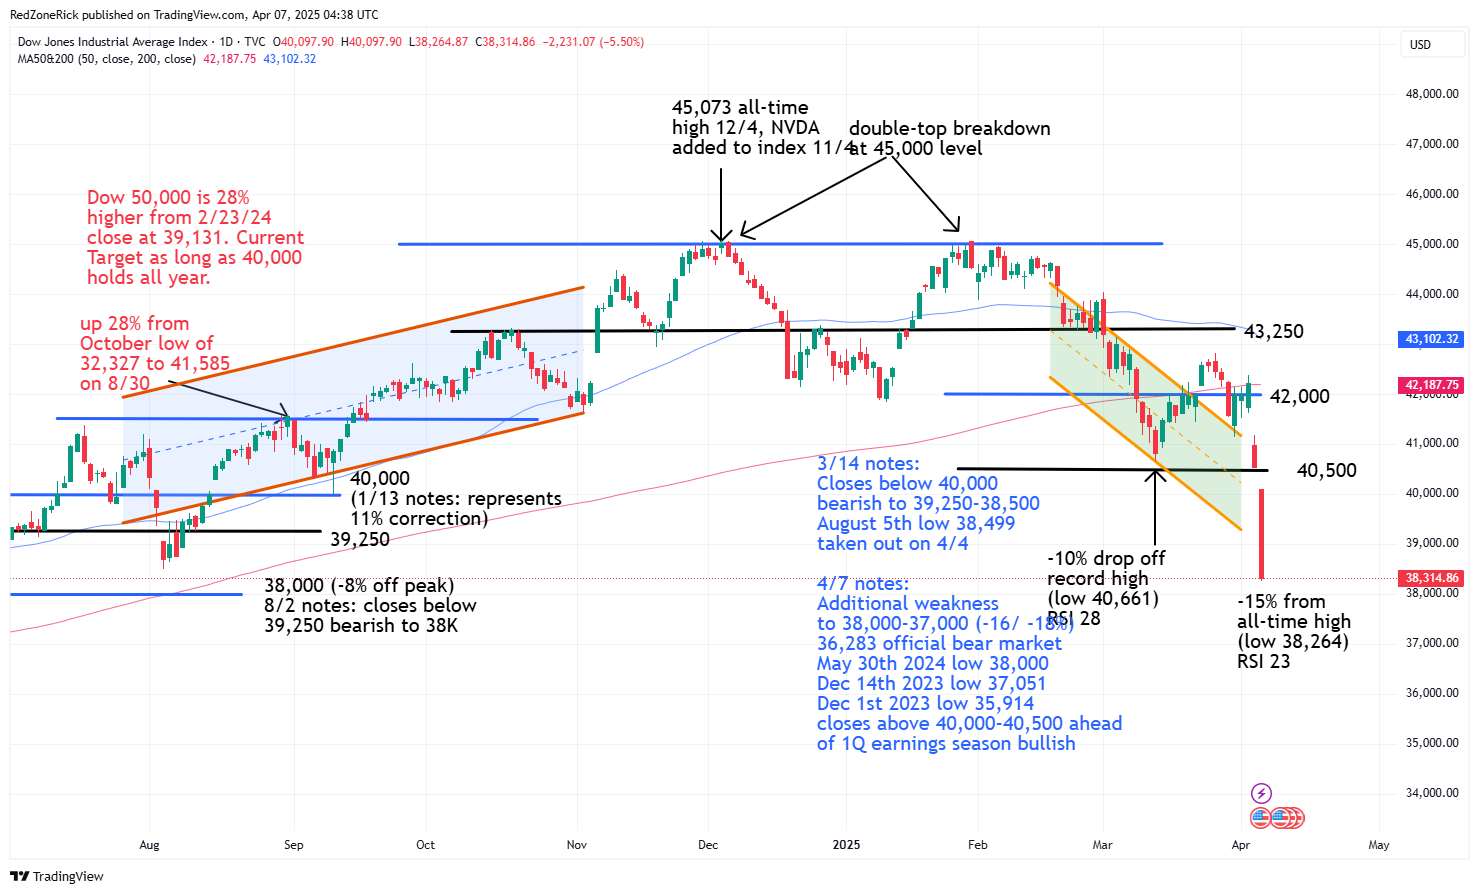
The Dow closed at 38,314 (-5.5%) after tagging an intraday low of 38,264. Fresh support at 38,250 held. Resistance is at 39,000.
Earnings and Economic News
Before the open: HomeToLife (HTLM)
After the close: Dave & Buster’s Entertainment (PLAY), Greenbrier Companies (GBX), Levi Strauss (LEVI)
Economic News
Consumer Credit – 3:00pm
Technical Outlook and Market Thoughts
The charts from mid-February warmed Wall Street a possible selloff was coming and the technical setups worsened right as the S&P 500 was setting an all-time high. We kept track of the developments from the golden cross that had formed in the VIX to the death-cross that was starting to develop in the small-caps.
In mid-March, our notes had lower lows and August 5th lows coming into play after a failed v-shape recovery and a one-week rally that failed to clear key resistance levels. The close above the 50-day moving average and 20 on back-to-back sessions in late March for the VIX was another bearish development we noted.
Typically after a selloff of last week’s magnitude, there is a three-day feeling out period that most professional traders like to use to start fresh bullish, or bearish, setups. It’s called bargain hunting but you still have to keep track of the trend as lower lows could still be in play.
One of first technical indicators we looked at after Thursday’s and Friday’s closes were the RSI (relative strength index) levels for the major indexes. The Nasdaq’s RSI was at 30 and 24; the S&P’s was at 31 and 23; the Dow’s RSI levels were at 33 and 23; and the Russell’s at 29 and 24.
The previous RSI lows over the past four months have shown nice bounces at the 30 level but there could be additional weakness for a few weeks as March proved. Typically, this level indicates oversold conditions for a stock or index but we have talked about RSI levels reaching the lows 20’s, and in some cases, even the teens. In any event, the major indexes are in extremely oversold territory with the Nasdaq and the small-caps in official bear market territory.
The Russell 2000 plunged to an intraday low of 1,783 with upper support from November 2023 at 1,800-1,775 getting tripped but holding. This represented a 28% plunge off the all-time peak at 2,466 from last November. There is risk towards 1,750-1,700 if 1,775 fails and we wouldn’t be surprised if 1,633-1,635 comes into play. This represents the October 27th and 30th 2023 lows. The 1,700 level would represent a 31% drubbing for the small-caps while the double-bottom would be at 34%.
New resistance from Friday’s gap lower is at 1,875. If cleared, a gap up to 1,925-1,975 could come quickly. Closes back above 2,000 ahead of earnings season, or mid-April, would be slightly bullish.

The Nasdaq took out the August 5th low at 15,708 with key support from May 2024 at 15,600 getting breached but holding on Friday’s trip to 15,575. The intraday low and close puts the index into bear market territory (-23%) from the December 16th all-time top at 20,204. The next levels of support are at 15,250-15,000 with the April 19th and 22nd 2024 intraday lows at 15,222 and 15,265, respectively. This would represent a decline of 25%-26% if the two lowest targets are hit.
Resistance is at 15,750-16,000. Closes above the latter could position Tech to make a run at 16,750 ahead of the 1Q earnings season. A death-cross remains in play with the 50-day moving average on track to fall below the 200-day moving average at the 18,500 level.
The S&P also took out its August 5th low at 5,119 with Friday’s low at 5,069. Upper support from April 2024 at 5,100 failed to hold. There is downside action towards 5,000-4,950 on continued weakness with the April 19th and 22nd 2024 intraday lows at 4,953 and 4,969, respectively. These levels would represent a 19% selloff from the February 19th all-time top at 6,147. An “official” bear market would occur on a close below 4,948.
Resistance at 5,100-5,200. A close above 5,300 could lead to a quick run towards 5,400-5,500 and levels from last Thursday’s initial gap lower. The death-cross formation has gotten more pronounced following last week’s action.

The Dow breached its August 5th low at 38,499 with Friday’s low at 38,264. Upper support from June 2024 at 38,250-38,000 held. The May 30th low is at 38,000 even; the December 14th 2023 low is at 37,051 and would represent a 16%-18% spanking from last December’s record top at 45,073. A bear market would be in focus if the blue-chips fall below 36,283.
Lowered resistance is at 38,750-39,000 followed 39,750-40,000. Closes back above 40,500 and last Thursday’s low at 40,513 would be a slightly bullish development for a quick retest to 42,000 and the 200-day moving average.
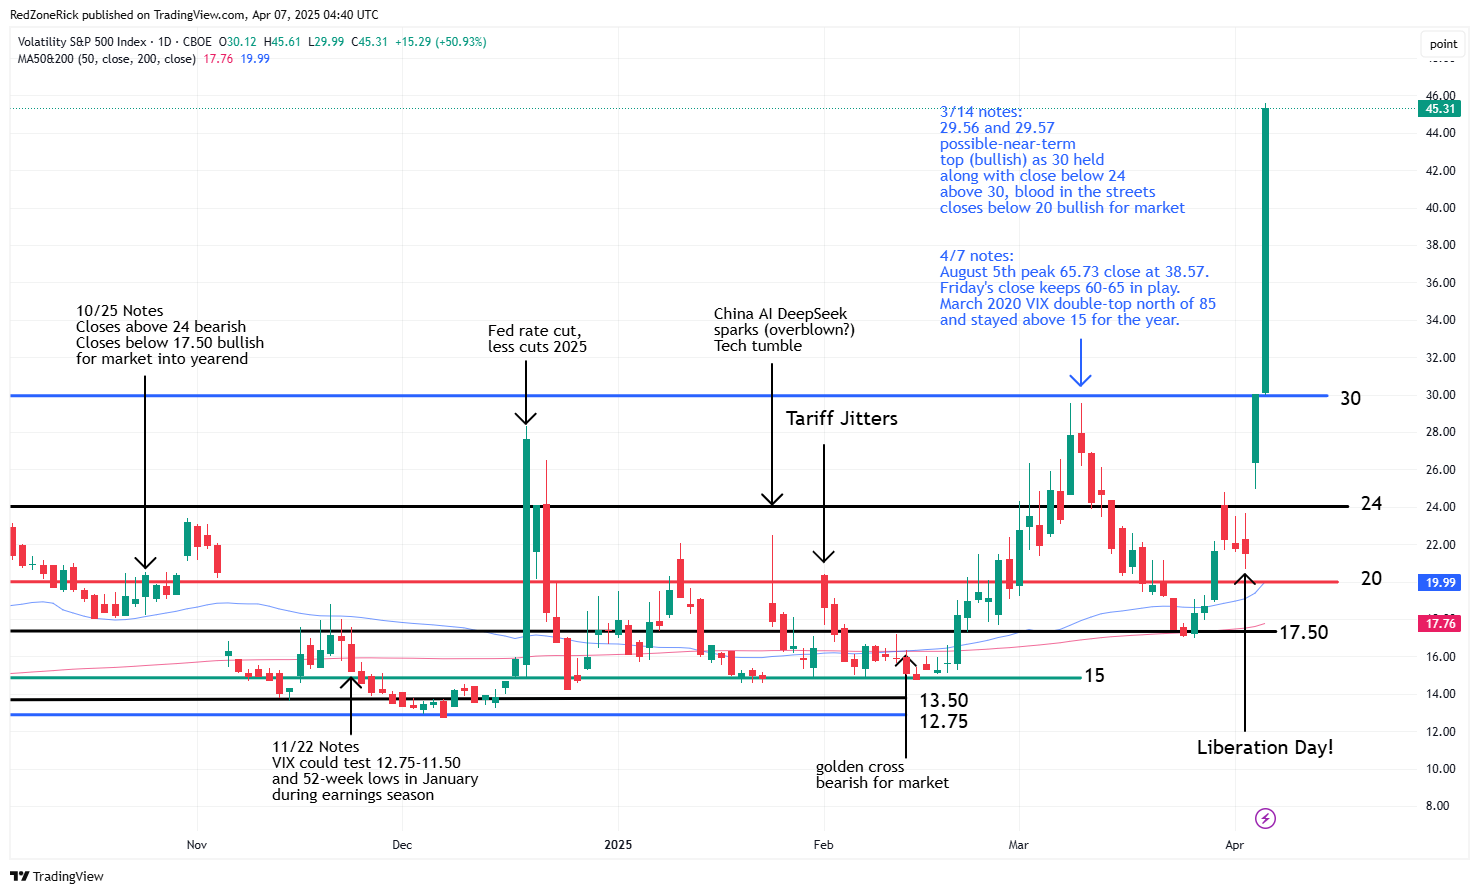
The Volatility Index (VIX) zoomed 40% on Thursday and nearly 50% on Friday with the late session peak at 45.61. The August 5th intraday peak reached 65.73 on the VIX with the close at 38.57. The August 6th close was at 27.71 (-28%). Friday’s close above 45 keeps upside towards 60-65 in the mix. In March 2020 the VIX traded north of 85 in back-to-back sessions and stayed elevated above 15 throughout the entire year.
Closes back below 30 to start the new week would help bullish sentiment but multiple closes below 24-20 are needed before we can start to trust any kind of recovery rally.
We often say we don’t care if the market is going up, or going down, as there are ways to profit on both sides. However, we do feel bad for investors, overall, that were exposed to last week’s violent selloff. For investors that don’t know how to use bearish strategies, the pounding in the chest is understandable but better times are ahead.
The charts have been warning for a test towards last August lows and in mid-February, we focused more on bearish setups while limited our exposure going long stocks. This was when a golden cross formed on the VIX, and typically a bullish signal for higher highs. Of course, higher volatility typically means lower lows for the overall market.
We have been using put options for directional action while selling in-the-money call options to lessen the blow in our covered call and dividend income portfolio. Our weekly credit spreads remain solid despite last week’s volatility.
With that said, we still need to watch the charts like a hawk to see when a near-term bottom could form, or if a continued selloff this month will be in play. Remember, the 1Q earnings season starts mid-month and will last throughout May. This means there will be plenty of opportunities for the news cycle (and algorithms) to drive price action.
As far as the tariff news, we think the impact will lessen over the next few weeks and good news on trade deals could help lead a rebound rally. Ongoing negotiations and the lessening of tariffs, percentage wise, or none at all should be positive catalysts for the market. We think deals could come quickly as President Trump likes to move at a rapid pace.