

Trading Ranges Signaling Possible Bottom
8:00am (EST)
The stock market rebounded on Friday with the slight gains keeping a tight trading range intact. More importantly, last week’s action may have been the start of a near-term bottoming process for the major indexes.
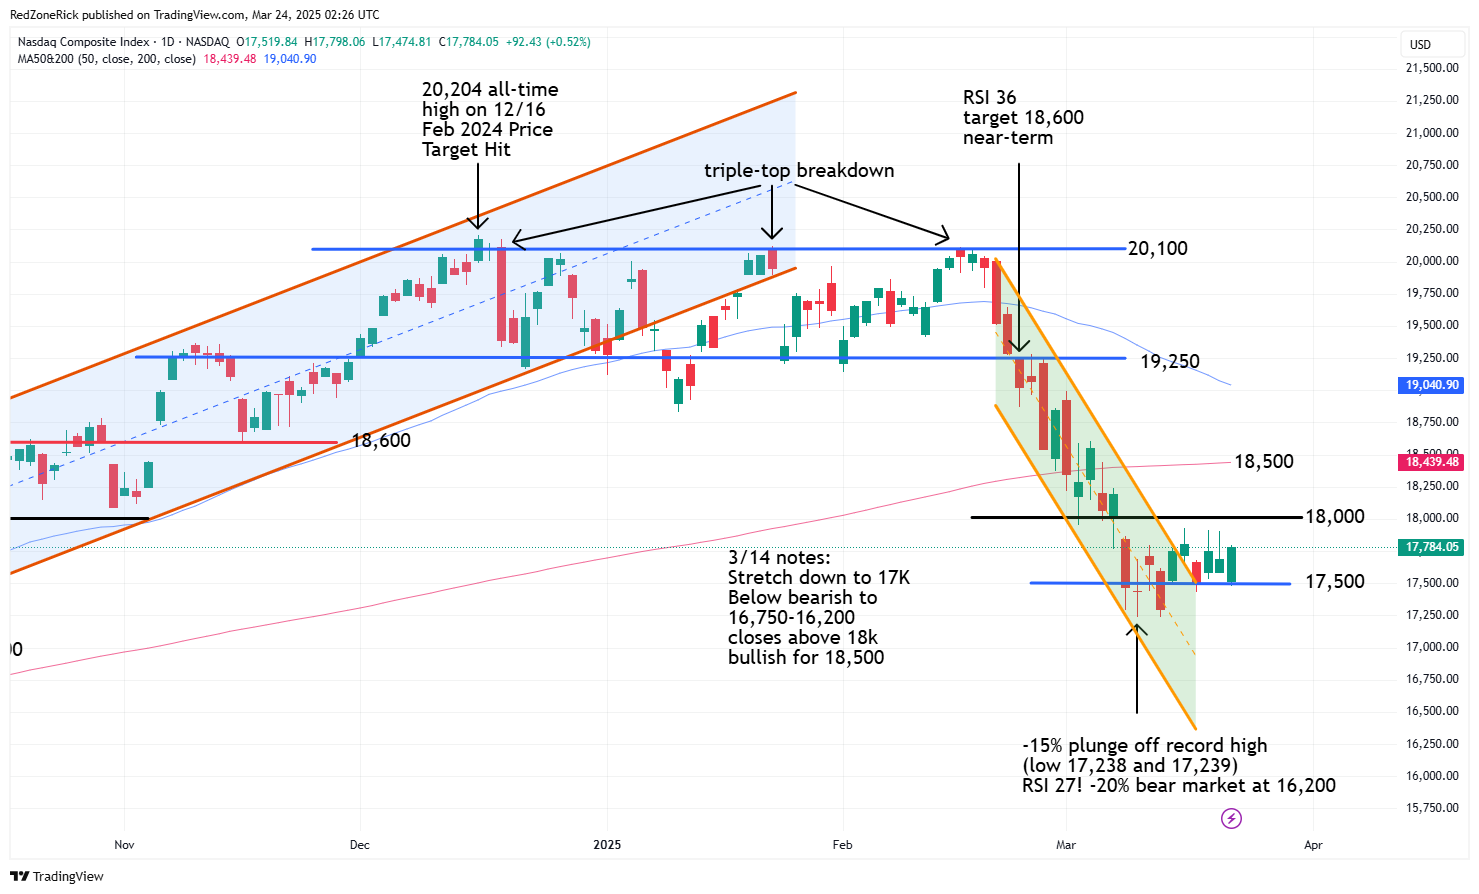
The Nasdaq closed at 17,784 (+0.5%) after tagging a high of 17,798. Near-term resistance at 17,750 was recovered. Key support is at 17,500.
The S&P 500 hit an afternoon peak of 5,670 while settling at 5,667 (+0.1%). Key resistance at 5,700 held. Support is at 5,600.
The Dow went out at 41,985 (+0.1%) with the high at 42,011. Resistance at 42,000 was topped but held. Support is at 41,500.
Earnings and Economic News
Before the open: Intuitive Machines (LUNR), Lucid Diagnostics (LUCD), Wag! Group (PET)
After the close: Dragonfly Energy (DFLI), KB Home (KB), Oklo (OKLO)
Economic News
PMI Services Index – 9:45am
Technical Outlook and Market Thoughts
Wall Street showed some resiliency last week with the choppy action signaling the start of a possible bottoming process and v-shape recovery. The major indexes mostly remain in mini trading ranges but the more stable action helped break a nasty four-week downtrend.
This doesn’t mean lower lows won’t return, it just gives us better clues on when another breakdown could occur. For now, key resistance levels remain in play, but it was at least a start by the bulls to help alleviate some of the recent selling pressure.
The most important development from last week was the action in the Volatility Index (VIX) as we mentioned multiple closes below 20 after the Fed update would be bullish for the market.
Wednesday’s close at 19.90 was beautiful to see as it held into Friday’s close with the lower weekly low tagging reached 19.15. Upper support at 19-18.50 and the 50-day moving average easily held. Closes below 17.50 and the 200-day moving average this upcoming week would be an ongoing bullish signal.
Lowered resistance is at 20-22.50 with the former getting pushed by the bears to close out the week. Keep in mind a close back above 24 would be a red flag again for the market.

The Nasdaq has traded between 17,500-18,000 over the last 10 sessions with key resistance at 18,000 easily holding. Multiple closes above this level would suggest strength to 18,500 and the 200-day moving average. Additional hurdles are at 19,000-19,250 and the 50-day moving average.
Crucial support is at 17,500 with the monthly and six-month low at 17,238. This represented a 15% drubbing off the December 16th all-time peak at 20,204. A close below 17,250 would likely get 16,750-16,500 in focus. The 16,250-16,200 area represents bear-market territory (-20%) for the index.
The S&P has been in a 10-session range, as well, between 5,500-5,700 with the latter getting stretched on Wednesday and Thursday. More important resistance is at 5,750 and the 200-day moving average followed by 5,850.
Support is at 5,600 with risk back to 5,500 on a drop below this level. A move below 5,500 gets correction territory and double-digit losses back in play with additional selling pressure down to 5,400-5,200.

The Dow is in a nine-session range between 40,500-42,000 following Friday’s inability to clear the 200-day moving average. Multiple closes above 42,000 gets gap up potential towards 43,250 in the mix.
Near-term support is at 40,500 with the March 13th low at 40,661. Closes below these levels would indicate a further fade to 40,000 and prior support from mid-September.

A death-cross officially formed on the Russell 2000 on Thursday after the index closed back below 2,075. This battle ground was held by the bears again on Friday. While continued closes above 2,075 would be nice, the charts show more important hurdles at 2,135 and 2,200. The latter is also the area where the 200-day/ 50-day moving averages have formed a death-cross.
Support is at 2,050 with last Monday’s low is at 2,039. A move below these levels would suggest another backtest towards 2,000 and the bottom of the current 11-session trading range. The intraday yearly low at 1,984 from the prior Thursday briefly triggered a bear market (-20%) for the small-caps.

Another chart we wanted to show you was the action in the iPath Series B S&P 500 VIX Short-Term Futures (VXX). The charts show key resistance after the August 5th lows at 57-58 has held on the previous four selloffs in the market. The prior Tuesday’s peak reached 60.28 with the close coming in at 56.94. This was a good clue ahead of last week’s action that a bottoming process could be forming in the major indexes.
Support is at 47.50 and the 200-day moving average followed by 46 and the 50-day moving average. Closes below these levels would be an ongoing bullish development for the overall market.

The current trading range for the overall market could continue until month end as Wall Street awaits the beginning of the April 2nd tariff kickoffs. While this was the reasoning for the four-week selloff, according to the talking heads, the real reason for the weakness was the technical breakdown out of the uptrend channels in the major indexes.
Once that took place, the algorithms stepped in to drive price action exactly into bear market and correction territory. This is why we do the daily, weekly, and longer-term chart work for the major indexes as it gives us the early jump on trend changes and possible market tops and bottoms.
We warned that February was typically a bearish month for the market. In mid-February, when a golden-cross for the VIX, this confirmed lower lows were forthcoming for the stock market and why we traded light or used bearish setups.
The charts remain bearish for the major indexes but we are preparing for a possible retest towards the 200-day MA’s for the major indexes over the near-term. The first-quarter earnings season will also be getting underway the second week of April so we expect the action to stay extremely exciting over the next few months.
The results from corporate America could help a possible v-shape recovery and maybe a push towards the 50-day moving averages, or, induce fresh yearly lows next month.