Trump Signs Stimulus Package, U.S. Markets Near Record Territory
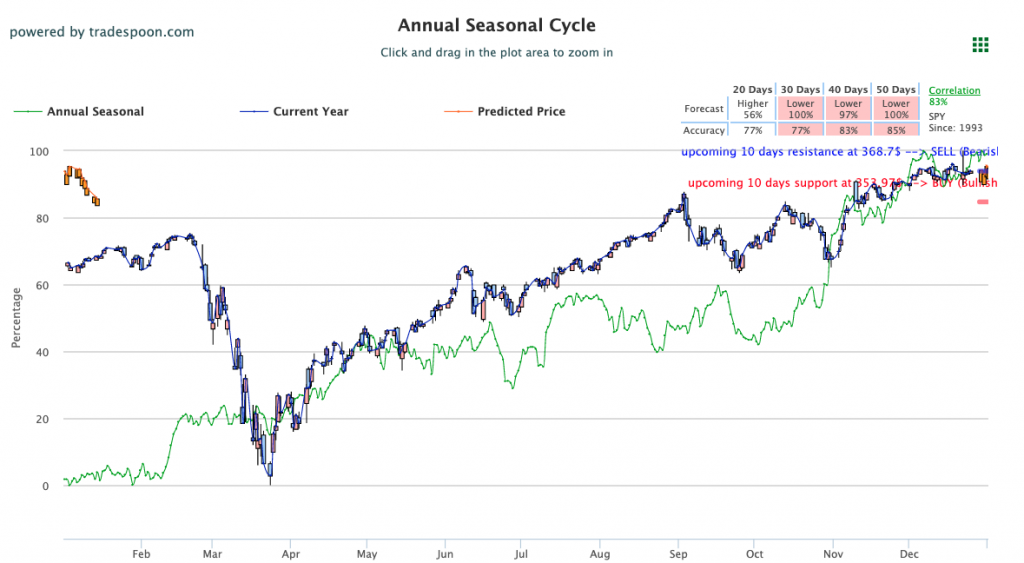
Following an initial standoff with Congress, President Trump signed the second economic stimulus package of 2020, sending all three major U.S. indices significantly higher. The legislation will also include $1.4 trillion to fund the government through September 2021 and extend COVID-related economic relief efforts. The Dow, S&P, and Nasdaq are all trading near record highs today as U.S. markets are on track to finish the last trading week of 2020 with impressive gains. Similar to last week, markets will close following Thursday in observance of the New Year’s holiday on Friday. As usual for this time of year, trading will remain light through the holiday week with only a handful of significant economic reports scheduled to release. COVID infection rate and vaccine distribution remain in focus this week as the U.S. tally for confirmed cases topped 19 million. We believe the SPY could be on its way to retest recent highs as we are seeing continued rotation from growth to value stocks. Until an additional breakout is maintained, our models are projecting SPY to trade in the range of $354-$380. The market could be prone to further corrections and the next level of support is set at $354. We encourage all market commentary readers to maintain clearly defined stop-levels for all positions. For reference, the SPY Seasonal Chart is shown below:
Key U.S. Economic Reports/Events This Week:
Pending Home Sales (November) – Wednesday
Weekly Jobless Claims (12/26) – Thursday
New Year’s Day (Markets Closed) – Friday
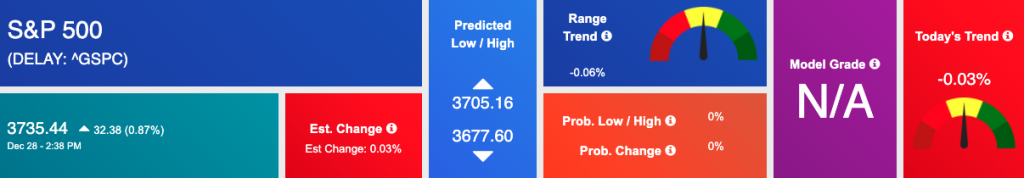
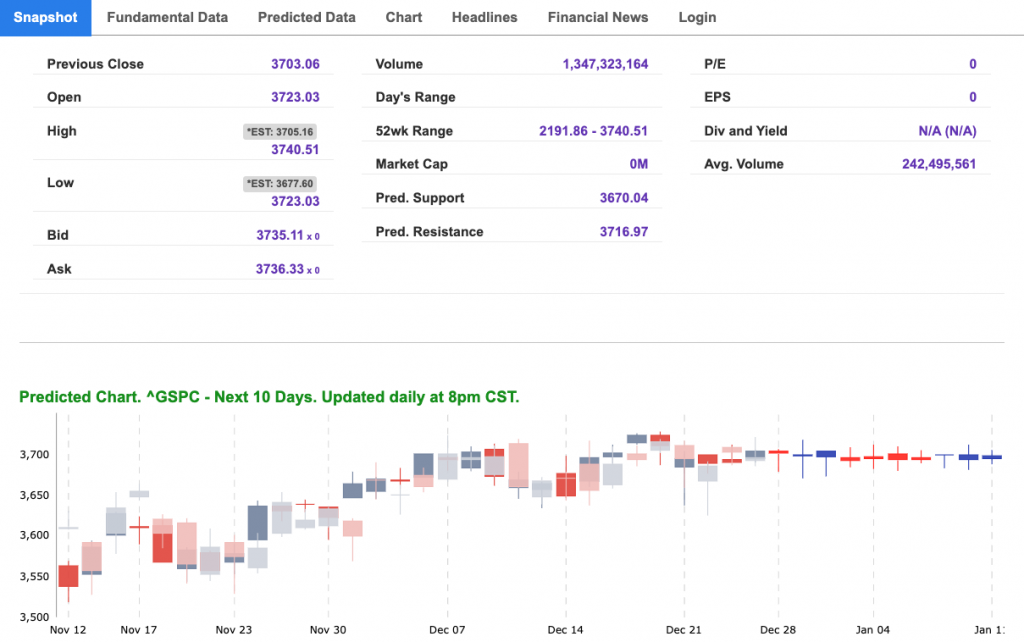
For reference, the S&P 10-Day Forecast is shown below:
Vlad’s Portfolio Lifetime Membership!
DO AS I DO… AS I DO IT WATCH LIVE AS I WORK THE MARKETS! TRY IT NOW RISK-FREE!
Click Here to Sign Up
Tuesday Morning Featured Symbol
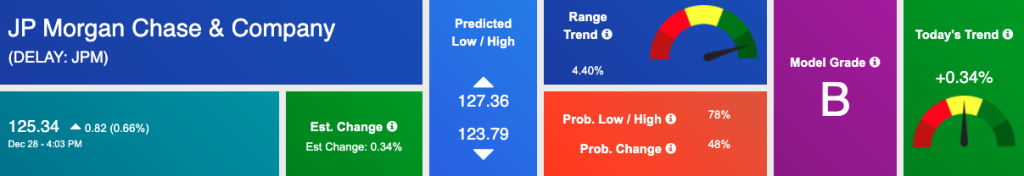
Our featured symbol for Tuesday is JP Morgan Chase & Company (JPM). JPM is showing a steady vector in our Stock Forecast Toolbox’s 10-day forecast.
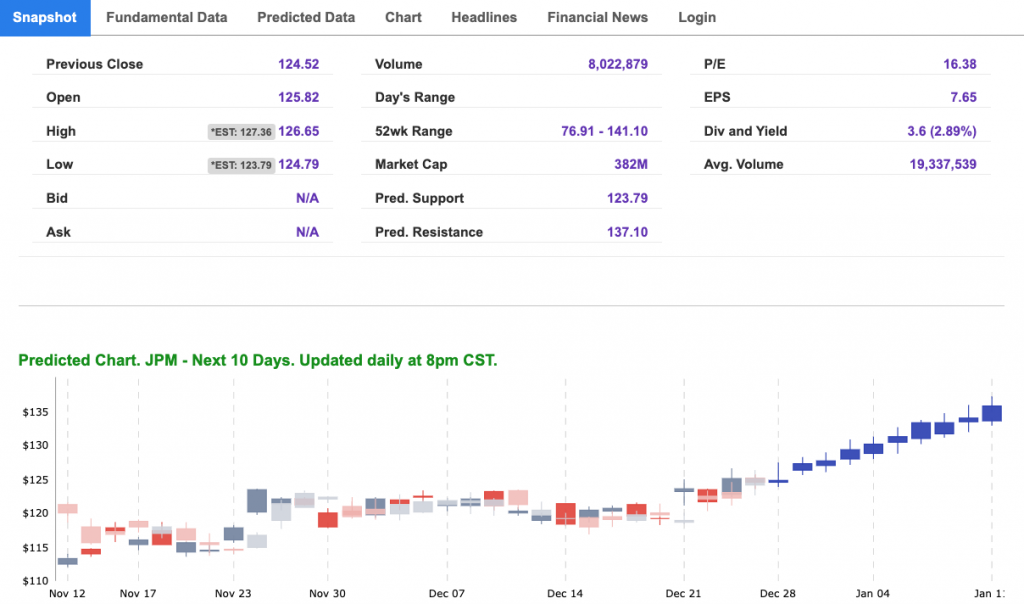
The stock is trading at $125.34 with a vector of 0.34% at the time of publication.
10-Day Prediction data is uploaded after the market close at 6 p.m., CST. Today’s data is based on market signals from the previous trading session.
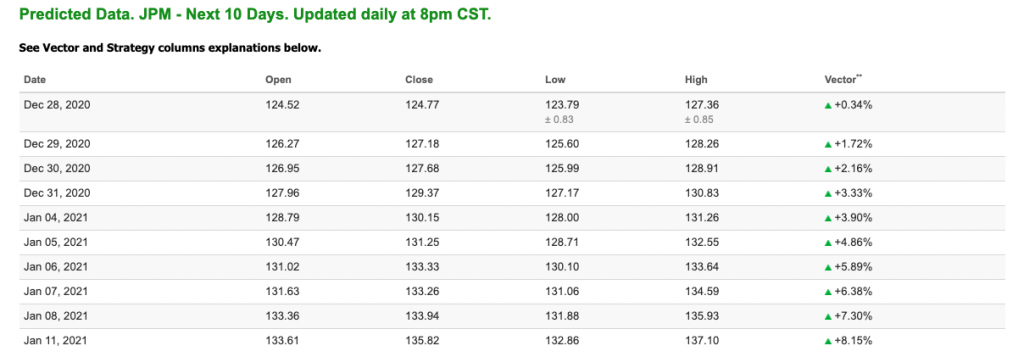
Note: The Vector column calculates the change of the Forecasted Average Price for the next trading session relative to the average of actual prices for the last trading session. The column shows the expected average price movement “Up or Down”, in percent. Trend traders should trade along the predicted direction of the Vector. The higher the value of the Vector the higher its momentum.
*Please note: At the time of publication Vlad Karpel does have a position in the featured symbol, JPM. Our featured symbol is part of your free subscription service. It is not included in any paid Tradespoon subscription service. Vlad Karpel only trades his money in paid subscription services. If you are a paid subscriber, please review your Premium Member Picks, ActiveTrader, or MonthlyTrader recommendations. If you are interested in receiving Vlad’s picks, please click here.
Oil
West Texas Intermediate for Crude Oil delivery (CL.1) is priced at $47.69 per barrel, down 1.12% at the time of publication.
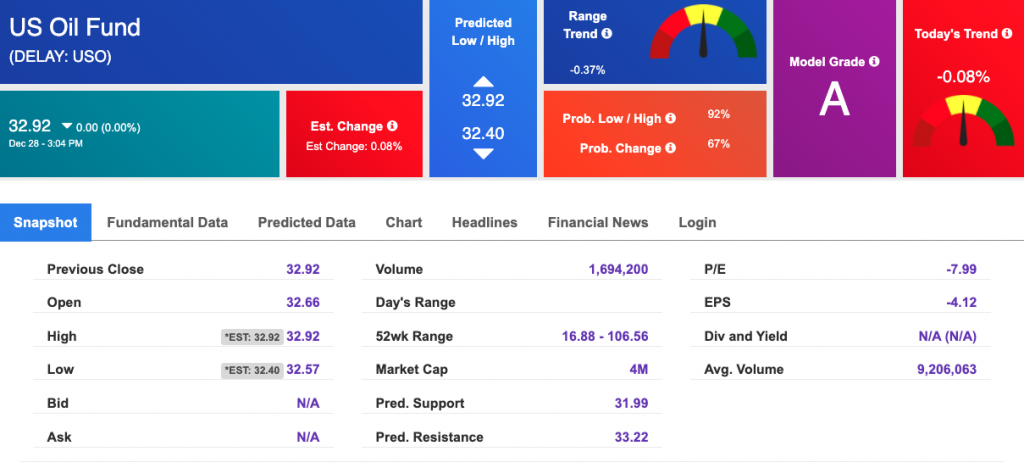
Looking at USO, a crude oil tracker, our 10-day prediction model shows mixed signals. The fund is trading at $32.92 at the time of publication. Prediction data is uploaded after the market close at 6 p.m., CST. Today’s data is based on market signals from the previous trading session.
Gold
The price for the Gold Continuous Contract (GC00) is down 0.34% at $1876.80 at the time of publication.
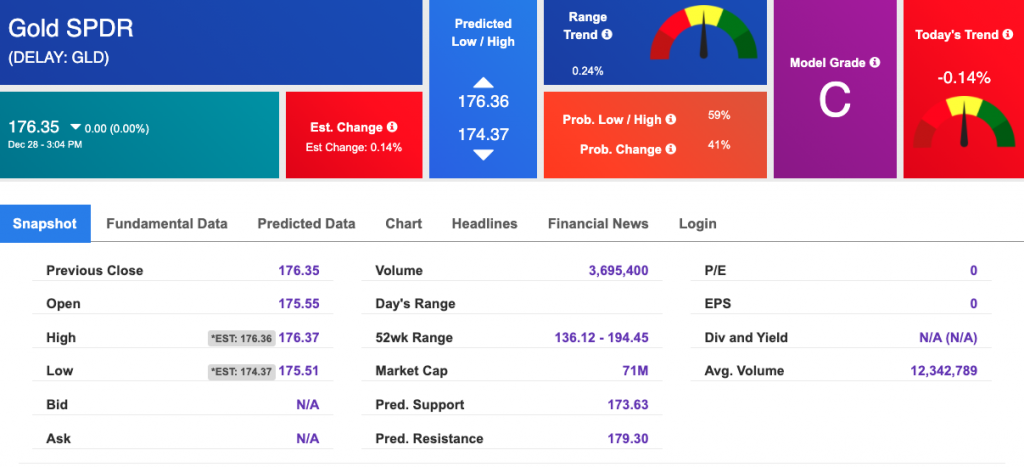
Using SPDR GOLD TRUST (GLD) as a tracker in our Stock Forecast Tool, the 10-day prediction window shows mixed signals. The gold proxy is trading at $176.35, at the time of publication. Vector signals show -0.14% for today. Prediction data is uploaded after the market close at 6 p.m., CST. Today’s data is based on market signals from the previous trading session.
Treasuries
The yield on the 10-year Treasury note is up, at 0.923% at the time of publication.
The yield on the 30-year Treasury note is up, at 1.663% at the time of publication.
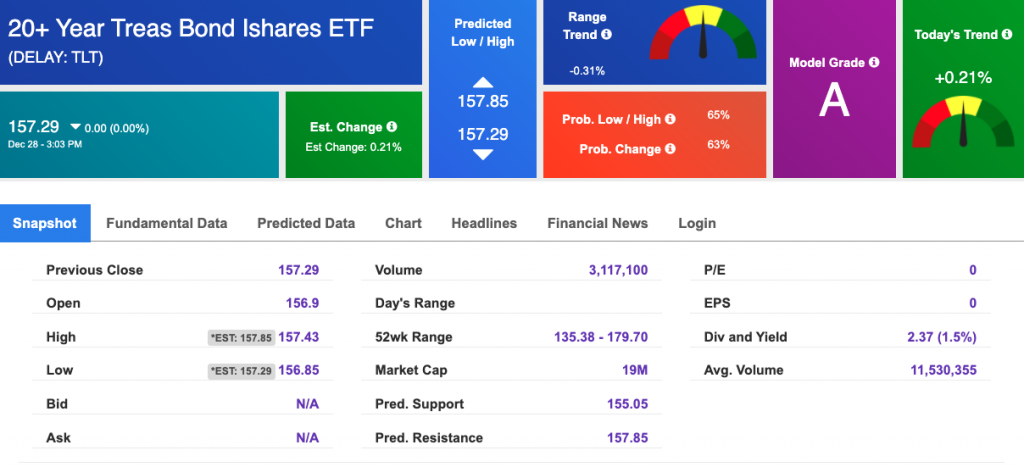
Using the iShares 20+ Year Treasury Bond ETF (TLT) as a proxy for bond prices in our Stock Forecast Tool, we see mixed signals in our 10-day prediction window. Prediction data is uploaded after the market close at 6 p.m., CST. Today’s data is based on market signals from the previous trading session.
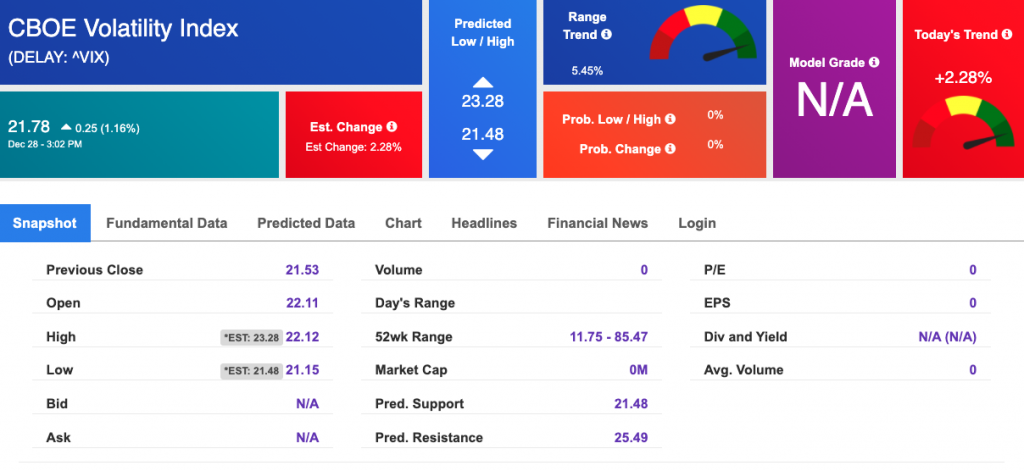
Volatility
The CBOE Volatility Index (^VIX) is $21.78 at the time of publication, and our 10-day prediction window shows mixed signals. Prediction data is uploaded after the market close at 6 p.m., CST. Today’s data is based on market signals from the previous trading session.