U.S. Benchmarks Post Impressive Gains Following Inflation Reading
After reading on inflation came in near a four-decade high, the Dow Jones Industrial Average and other key stock indexes closed with modest gains Wednesday. U.S. stocks rose Wednesday, relieved after the most recent reading on inflation didn’t turn out to be worse than expected. In December, the consumer-price index rose 0.5 percent on a monthly basis, as costs increased by nearly 40 percent from a year ago and indicated that sustained U.S. inflation may continue into 2022. The Federal Reserve’s next meeting takes place in two weeks, and investors are awaiting a blueprint on how it plans to shrink its balance sheet, including possibly selling assets, which Chairman Jerome Powell didn’t deny Tuesday, during his confirmation hearing for a second term as the bank’s chief. The latest Federal Reserve Beige Book report, which provides a detailed look at current economic conditions in the US, showed that business capacity to pass on price increases to customers improved significantly in December, contrary to earlier years.
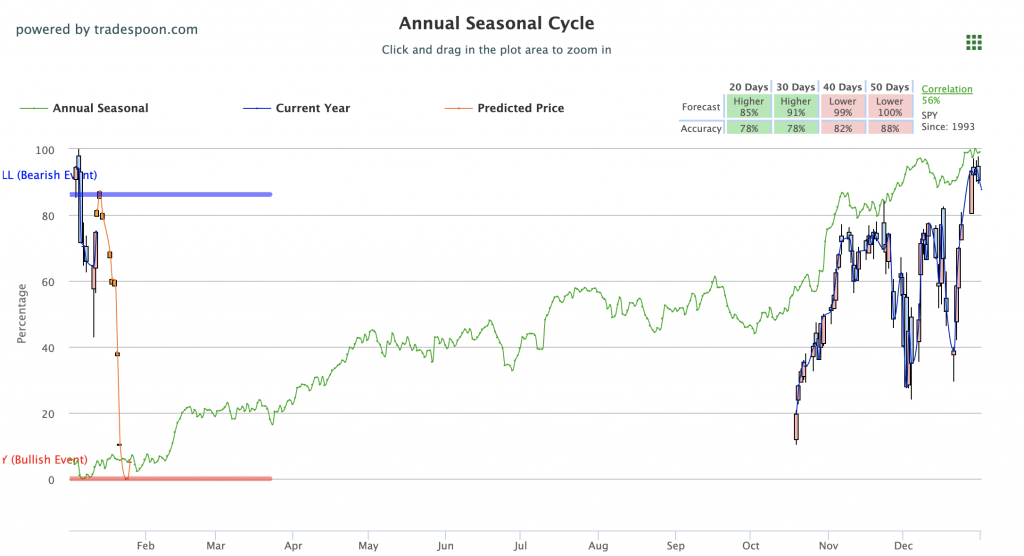
With $VIX having recently spiked to 24-level and then pulling back to 20-level, the $QQQ continues to approach 200 DMA. We expect the market to continue trading sideways into the first quarter of 2022 and we are watching the vital support levels in the SPY, which are presently at $450 and then $440. $QQQ is trading below the 50-day moving average on the precipitous drop in $TLT. Omicron virus, the fear of inflation, Fed hawking statement, CPI December numbers this week can impact the next move in the market. Globally, both European and Asian markets finished with strong gains. We encourage all market commentary readers to maintain clearly defined stop levels for all positions. For reference, the SPY Seasonal Chart is shown below:

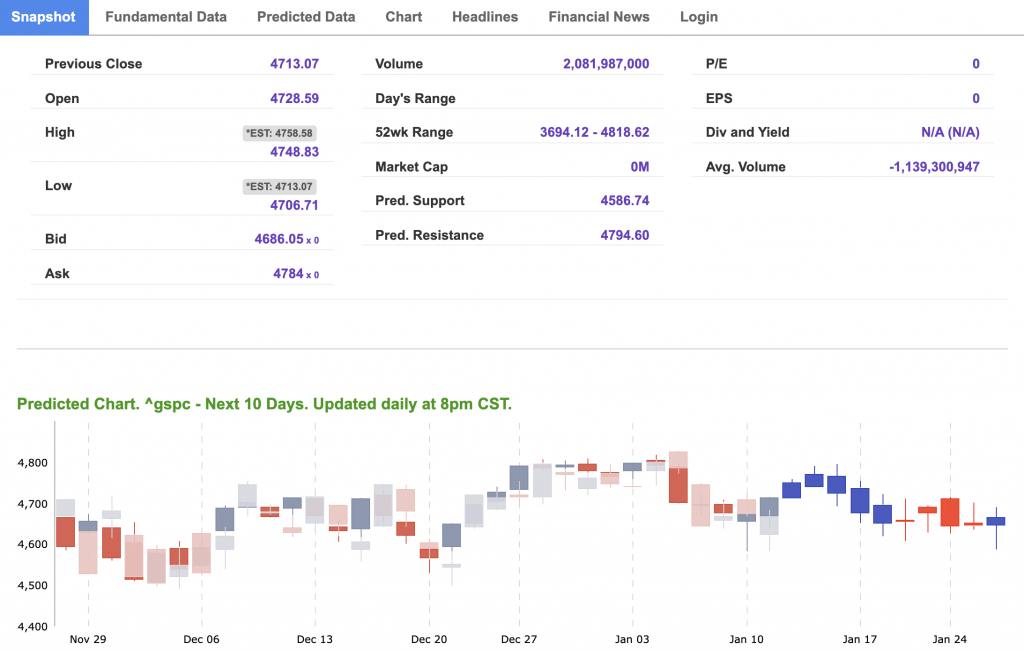
For reference, the S&P 10-Day Forecast is shown below:

Using the “^GSPC” symbol to analyze the S&P 500 our 10-day prediction window shows a near-term mixed outlook. Prediction data is uploaded after the market closes at 6 p.m. CST. Today’s data is based on market signals from the previous trading session.
Vlad’s Portfolio Lifetime Membership!
DO AS I DO… AS I DO IT WATCH LIVE AS I WORK THE MARKETS! TRY IT NOW RISK-FREE!
Click Here to Sign Up
Thursday Morning Featured Symbol

Our featured symbol for Thursday is Intel Corp (INTC). INTC is showing a steady vector in our Stock Forecast Toolbox’s 10-day forecast.
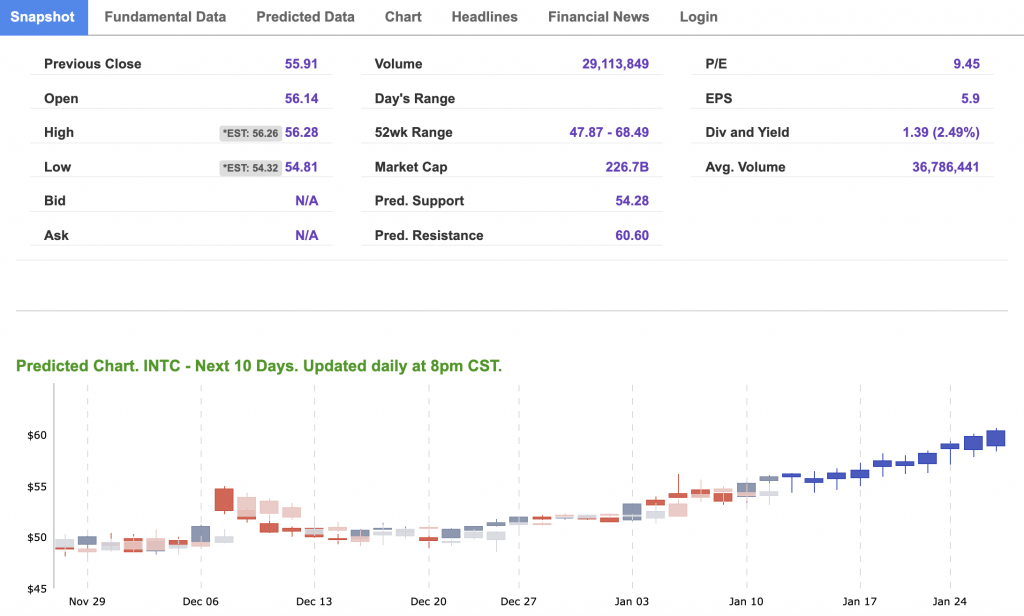
The symbol is trading at $55.74 with a vector of 0.19% at the time of publication.
10-Day Prediction data is uploaded after the market close at 6 p.m., CST. Today’s data is based on market signals from the previous trading session.
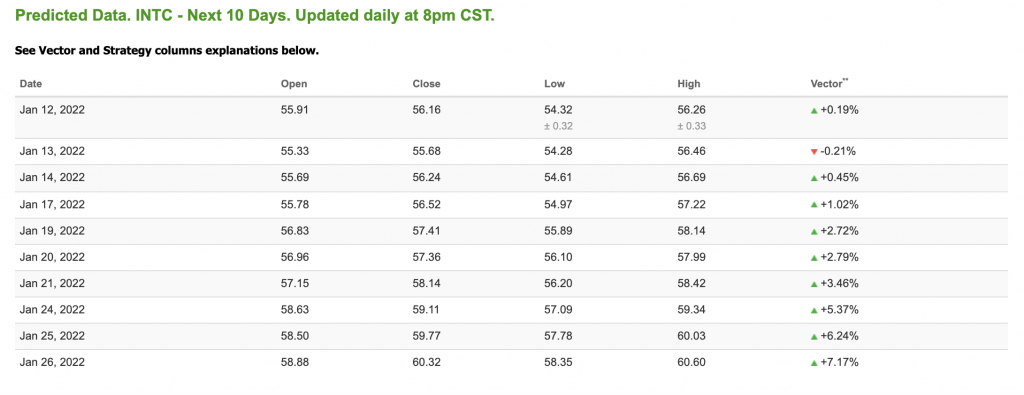
Note: The Vector column calculates the change of the Forecasted Average Price for the next trading session relative to the average of actual prices for the last trading session. The column shows the expected average price movement “Up or Down”, in percent. Trend traders should trade along the predicted direction of the Vector. The higher the value of the Vector the higher its momentum.
*Please note: At the time of publication Vlad Karpel does not have a position in the featured symbol, intc. Our featured symbol is part of your free subscription service. It is not included in any paid Tradespoon subscription service. Vlad Karpel only trades his money in paid subscription services. If you are a paid subscriber, please review your Premium Member Picks, ActiveTrader, or MonthlyTrader recommendations. If you are interested in receiving Vlad’s picks, please click here.
Oil
West Texas Intermediate for Crude Oil delivery (CL.1) is priced at $82.76 per barrel, up 1.90% at the time of publication.
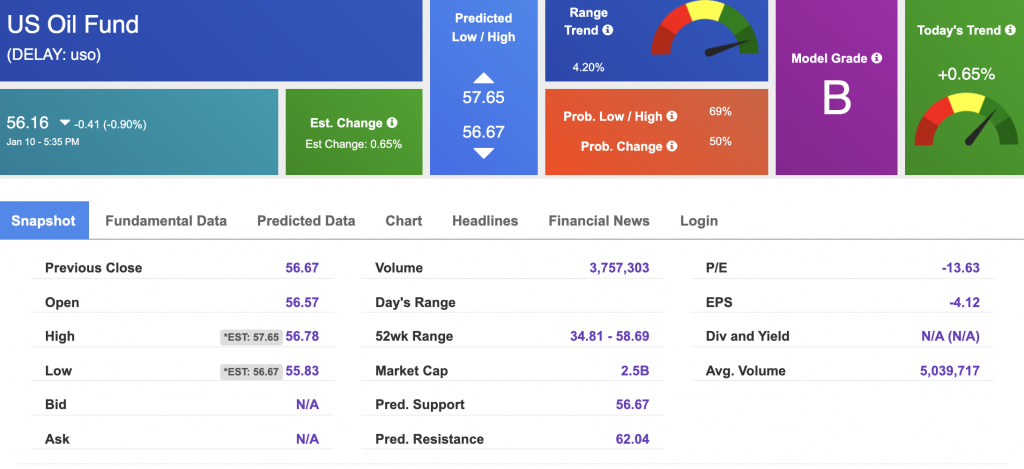
Looking at USO, a crude oil tracker, our 10-day prediction model shows mixed signals. The fund is trading at $56.15 at the time of publication. Prediction data is uploaded after the market close at 6 p.m., CST. Today’s data is based on market signals from the previous trading session.
Gold
The price for the Gold Continuous Contract (GC00) is up 0.40% at $1825.20 at the time of publication.
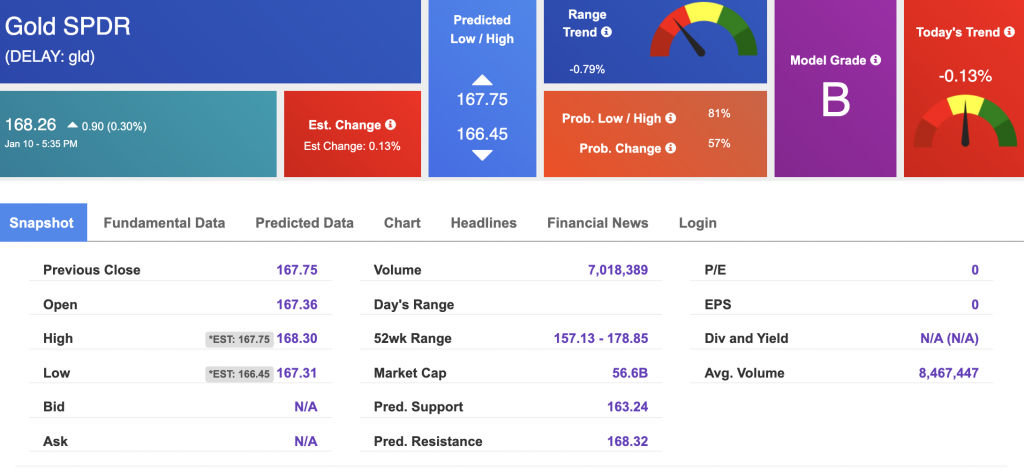
Using SPDR GOLD TRUST (GLD) as a tracker in our Stock Forecast Tool, the 10-day prediction window shows mixed signals. The gold proxy is trading at $168.26 at the time of publication. Vector signals show -0.13% for today. Prediction data is uploaded after the market close at 6 p.m., CST. Today’s data is based on market signals from the previous trading session.
Treasuries
The yield on the 10-year Treasury note is up, at 1.706% at the time of publication.
The yield on the 30-year Treasury note is up, at 2.102% at the time of publication.
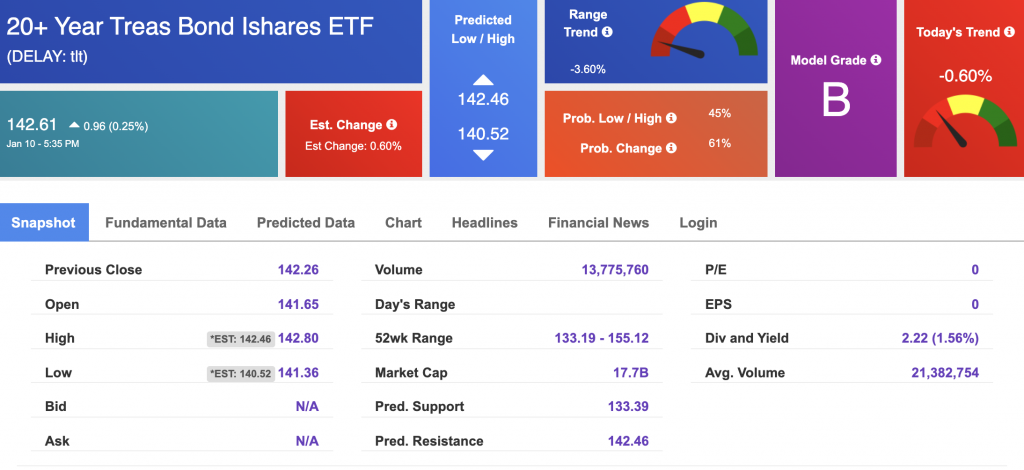
Using the iShares 20+ Year Treasury Bond ETF (TLT) as a proxy for bond prices in our Stock Forecast Tool, we see mixed signals in our 10-day prediction window. Prediction data is uploaded after the market close at 6 p.m., CST. Today’s data is based on market signals from the previous trading session.
Volatility
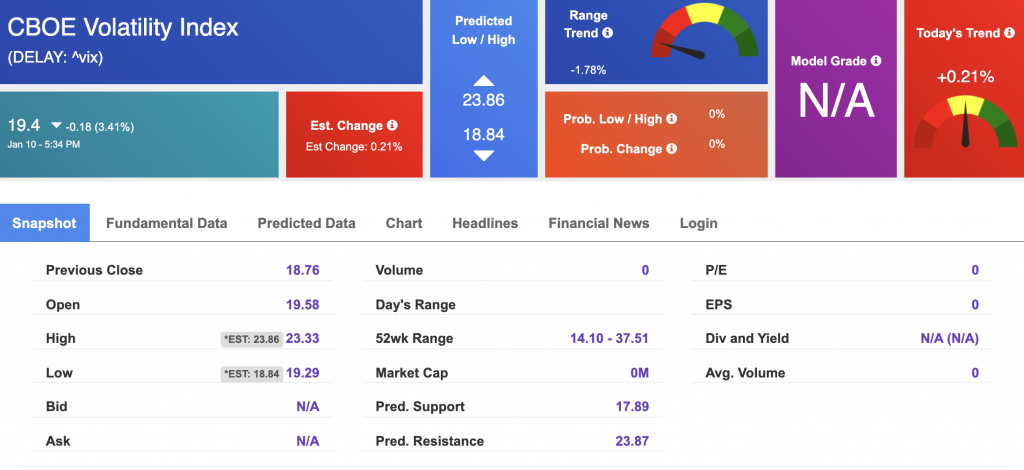
The CBOE Volatility Index (^VIX) is $19.4 at the time of publication, and our 10-day prediction window shows mixed signals. Prediction data is uploaded after the market close at 6 p.m., CST. Today’s data is based on market signals from the previous trading session.
