U.S. Markets Rebound Behind Impressive Tech Rally, Fed Budget Due Friday
SPY has a high probability of retesting $360
The new top for the SPY is set at $360 and we believe it will be retested by the end of September or early October. With the current SPY 50-day moving average at $330, our models are showing the SPY has a high probability of retesting these levels.
All three major U.S. indices snapped a three-day losing streak
Behind a strong tech rally, all three major U.S. indices snapped a three-day losing streak by closing in the green. Lululemon, Slack Tech, Oracle, and Chewy are due to release earnings this week will key economic reports include July Job Openings, Consumer and Producer Price Indices for August, Core CPI, and the Federal Budget for August.
Globally, both Asian and European markets closed in the red. With the SPY breaking through its overhead resistance at $340, short-term traders could consider adding to positions when SPY is near $320. Our models are still projecting the SPY to trade in the range of $320-$360 and we will look to be buyers into any short-term corrections. We will continue monitoring the VIX as the market can overshoot support and resistance levels when VIX is trading near $20 level, and we encourage all market commentary readers to maintain clearly defined stop-levels for all positions. For reference, the SPY Seasonal Chart is shown below:

Key U.S. Economic Reports/Events This Week
- Consumer Credit (July) – Tuesday
- Job Openings (July) – Wednesday
- Wholesale Inventories (July) – Thursday
- Producer Price Index (August) – Thursday
- Weekly Jobless Claims (9/5) – Thursday
- Consumer Price Index (August) – Friday
- Core CPI (August) – Friday
- Federal Budget (August) – Friday
(Want free training resources? Check our our training section for videos and tips!)
For reference, the S&P 10-Day Forecast is shown below:

Using the “^GSPC” symbol to analyze the S&P 500 our 10-day prediction window shows a near-term positive outlook. Prediction data is uploaded after the market closes at 6 p.m. CST. Today’s data is based on market signals from the previous trading session.

ROBOINVESTOR SPECIAL:
Breakthrough, high-tech Artificial Intelligence platform available to Tradespoon’s individual investors:
Click Here – To See Where AI Places My Money
Thursday Morning Featured Symbol

Our featured symbol for Thursday is Coca-Cola Company (KO). KO is showing a steady vector in our Stock Forecast Toolbox’s 10-day forecast. This stock is assigned a Model Grade of (B) indicating it ranks in the top 25th percentile for accuracy for current-day predicted support and resistance, relative to our entire data universe.
(Want free training resources? Check our our training section for videos and tips!)

The stock is trading at $50.19 with a vector of -1.44% at the time of publication.
10-Day Prediction data is uploaded after the market close at 6 p.m., CST. Today’s data is based on market signals from the previous trading session.
(Want free training resources? Check our our training section for videos and tips!)
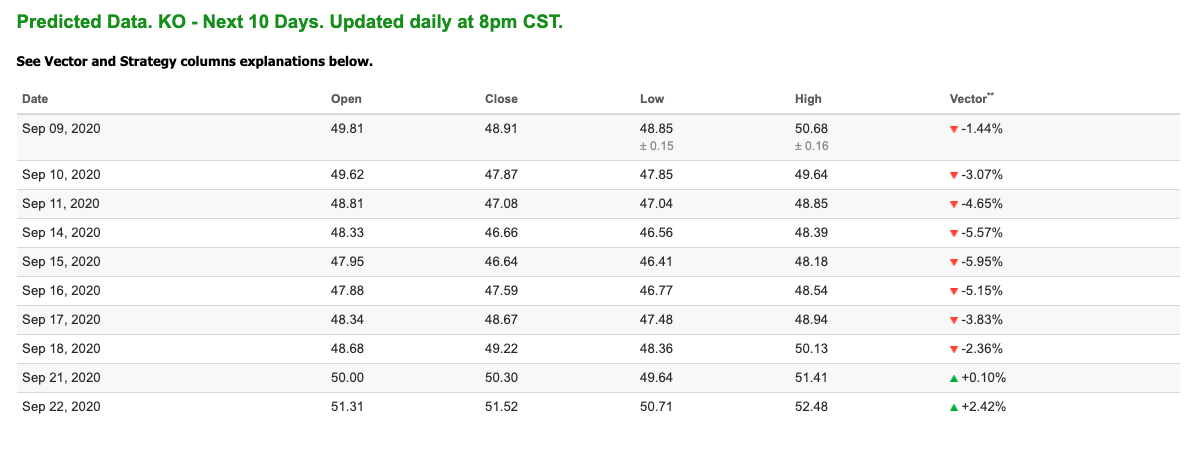
Note: The Vector column calculates the change of the Forecasted Average Price for the next trading session relative to the average of actual prices for the last trading session. The column shows the expected average price movement “Up or Down”, in percent. Trend traders should trade along the predicted direction of the Vector. The higher the value of the Vector the higher its momentum.
*Please note: At the time of publication Vlad Karpel does have a position in the featured symbol, KO. Our featured symbol is part of your free subscription service. It is not included in any paid Tradespoon subscription service. Vlad Karpel only trades his money in paid subscription services. If you are a paid subscriber, please review your Premium Member Picks, ActiveTrader, or MonthlyTrader recommendations. If you are interested in receiving Vlad’s picks, please click here.
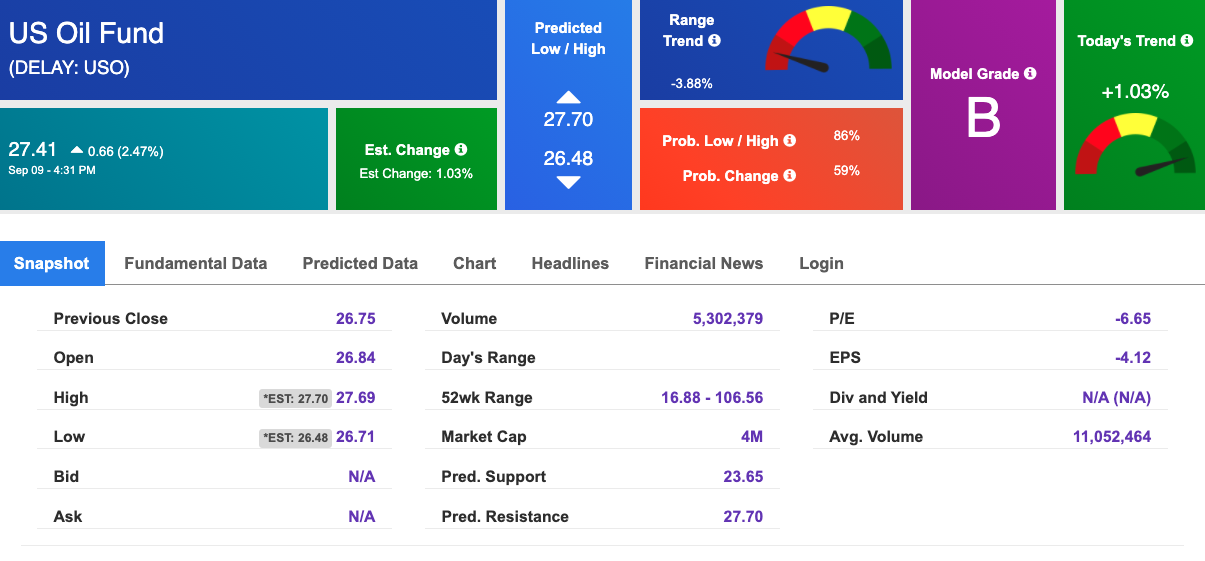
Oil
West Texas Intermediate for Crude Oil delivery (CL.1) is priced at $37.78 per barrel, up 2.77% at the time of publication.
Looking at USO, a crude oil tracker, our 10-day prediction model shows mixed signals. The fund is trading at $27.41 at the time of publication. Prediction data is uploaded after the market close at 6 p.m., CST. Today’s data is based on market signals from the previous trading session.
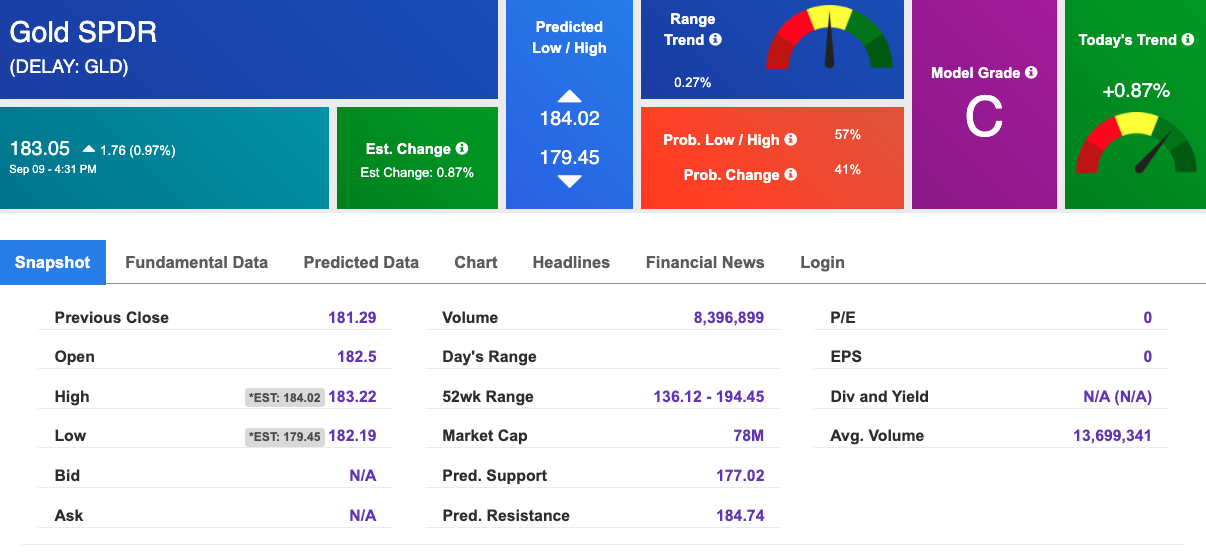
Gold
The price for the Gold Continuous Contract (GC00) is up 0.60% at $1,954.90 at the time of publication.
Using SPDR GOLD TRUST (GLD) as a tracker in our Stock Forecast Tool, the 10-day prediction window shows mixed signals. The gold proxy is trading at $183.05, at the time of publication. Vector signals show +0.87% for today. Prediction data is uploaded after the market close at 6 p.m., CST. Today’s data is based on market signals from the previous trading session.
(Want free training resources? Check our our training section for videos and tips!)
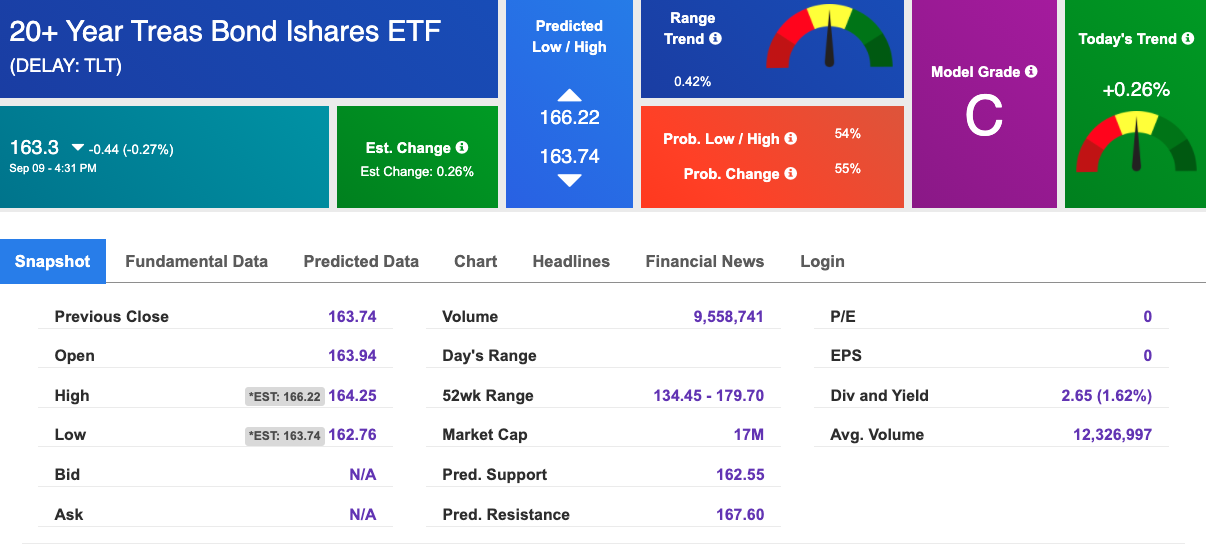
Treasuries
The yield on the 10-year Treasury note is up, at 0.702% at the time of publication.
The yield on the 30-year Treasury note is up, at 1.458% at the time of publication.
Using the iShares 20+ Year Treasury Bond ETF (TLT) as a proxy for bond prices in our Stock Forecast Tool, we see mixed signals in our 10-day prediction window. Prediction data is uploaded after the market close at 6 p.m., CST. Today’s data is based on market signals from the previous trading session.
(Want free training resources? Check our our training section for videos and tips!)
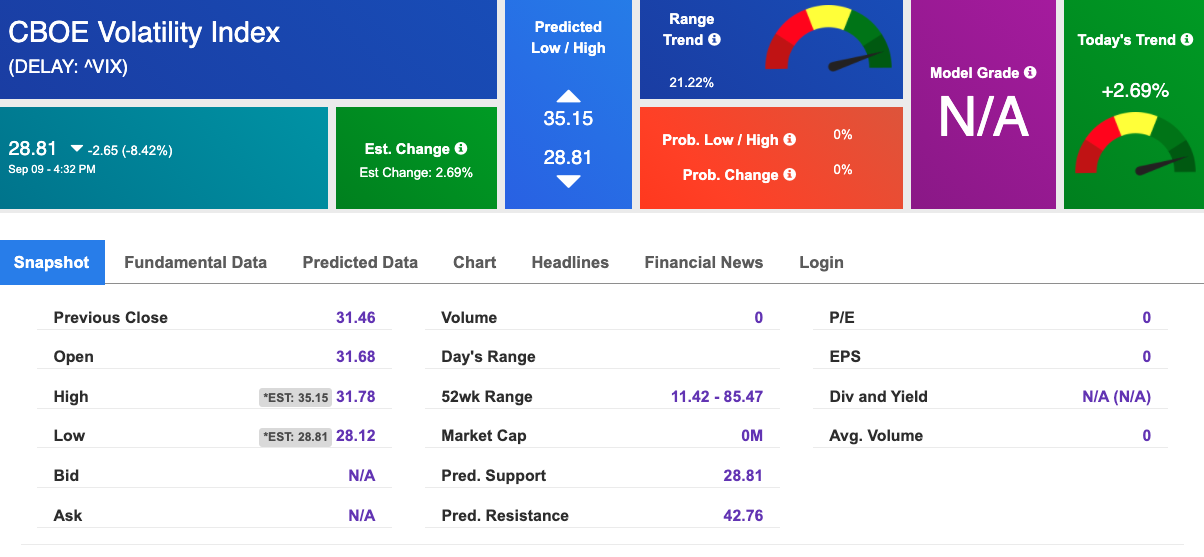
Volatility
The CBOE Volatility Index (^VIX) is $28.81 at the time of publication, and our 10-day prediction window shows mixed signals. Prediction data is uploaded after the market close at 6 p.m., CST. Today’s data is based on market signals from the previous trading session.
(Want free training resources? Check our our training section for videos and tips!)