U.S. Markets See Pressure As Inflation Concerns Mount
After snapping impressive multi-day streaks last week, major U.S. indices were pressured by inflation concerns, closing in the red on Monday. Boeing supported the Dow Jones Industrial Average early in the session, as the symbol railed over 5%, boosting the blue-chip index only to still close in the red as market-wide inflation concerns continue to mount. On Tuesday, the retail sales, industrial production, and import price index will be in the limelight, as traders await further inflation indicators that could inspire continued volatility or signal direction. Long-term Treasury yields hit a recent high the dollar, oil futures, and gold futures traded to muted results. Today’s economic calendar was light, but there were several key earnings announcements scheduled for the day. Earnings continue to be the main factor influencing markets; TGT, WMT, and BIDU are key earnings announcements this week that can potentially influence the market direction.
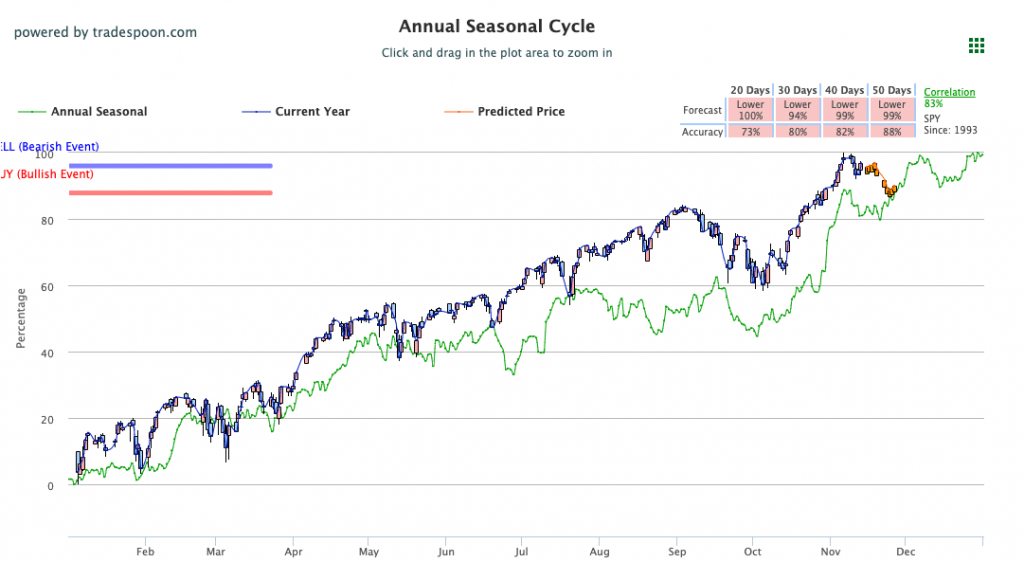
The VIX trades near the $17 level and fear of runaway inflation can impact the next move in the market as well. Please watch the critical support levels on the SPY at $462 and then at $455 as we do expect the market to continue to pull back in the next two weeks and then rebound toward the end of the month/early December. Globally, Asian markets traded to mixed results while European markets closed higher. We encourage all market commentary readers to maintain clearly defined stop levels for all positions. For reference, the SPY Seasonal Chart is shown below:
Key U.S. Economic Reports/Events This Week:
- Retail Sales (October) – Tuesday
- Import Price Index (October) – Tuesday
- Industrial Production (October) – Tuesday
- Capacity Utilization (October) – Tuesday
- Business Inventories (September) – Tuesday
- Building Permits (October) – Wednesday
- Housing Starts (October) – Wednesday
- Weekly Jobless Claims (11/13) – Thursday
- Leading Economic Indicators (October) – Thursday
‘If you’re looking for free trading resources… click here’
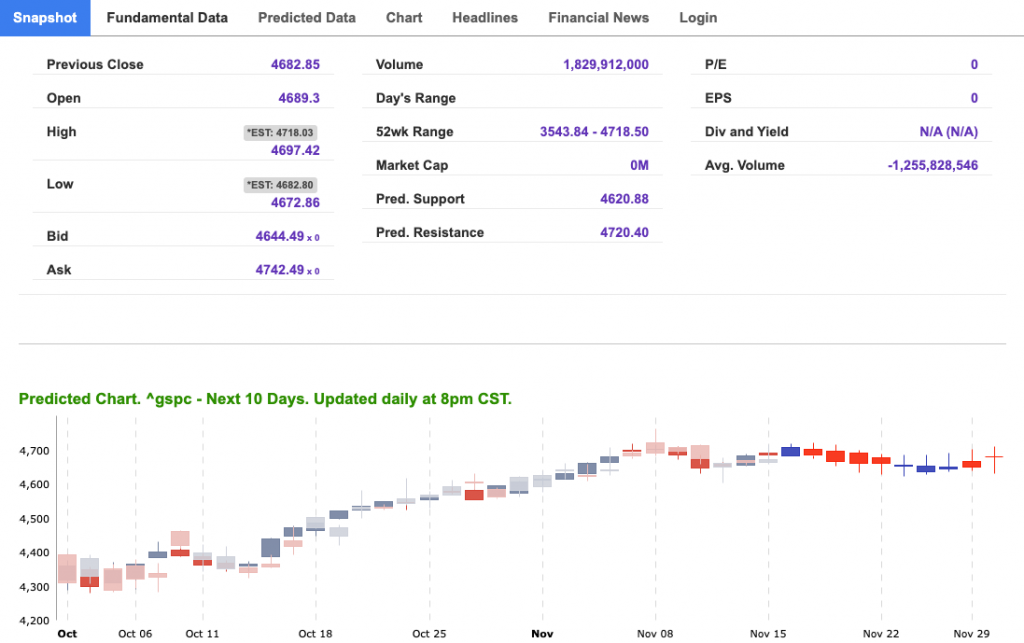
For reference, the S&P 10-Day Forecast is shown below:
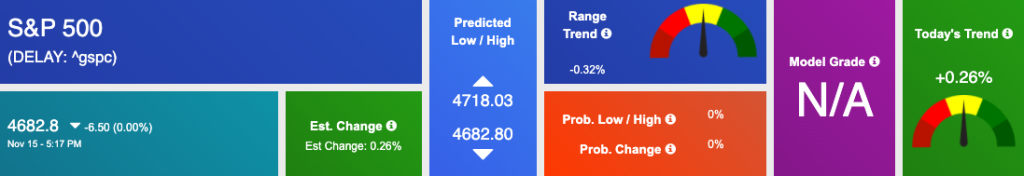
Using the “^GSPC” symbol to analyze the S&P 500 our 10-day prediction window shows a near-term mixed outlook. Prediction data uploaded after the market closes at 6 p.m. CST. Today’s data is based on market signals from the previous trading session.
Vlad’s Portfolio Lifetime Membership!
DO AS I DO… AS I DO IT WATCH LIVE AS I WORK THE MARKETS! TRY IT NOW RISK-FREE!
Click Here to Sign Up
Tuesday Morning Featured Symbol
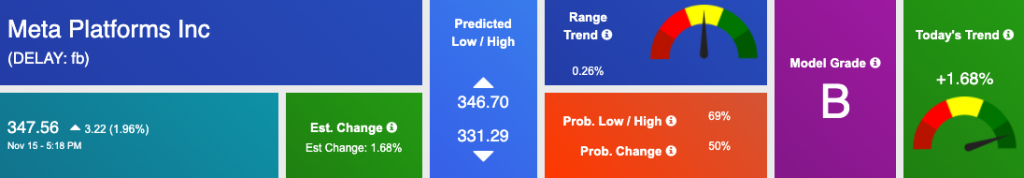
Our featured symbol for Tuesday is Meta Platforms Inc (FB). FB is showing a steady vector in our Stock Forecast Toolbox’s 10-day forecast.
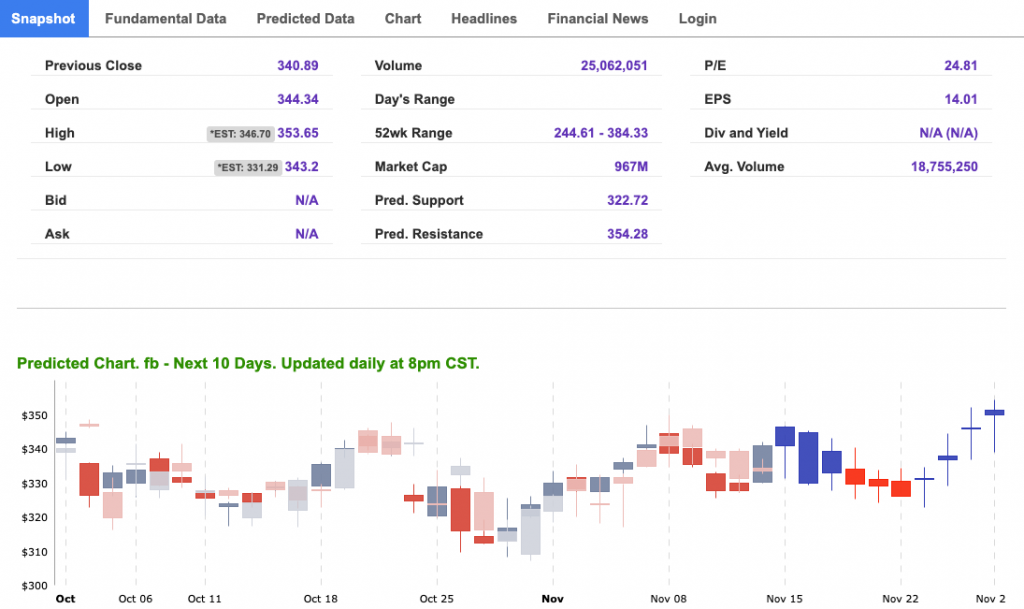
The symbol is trading at $347.56 with a vector of +1.68% at the time of publication.
10-Day Prediction data uploaded after the market close at 6 p.m., CST. Today’s data is based on market signals from the previous trading session.
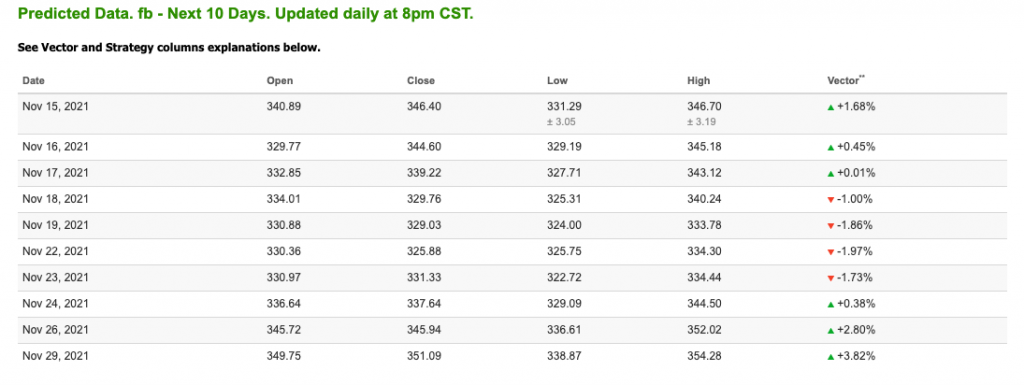
Note: The Vector column calculates the change of the Forecasted Average Price for the next trading session relative to the average of actual prices for the last trading session. The column shows the expected average price movement “Up or Down”, in percent. Trend traders should trade along the predicted direction of the Vector. The higher the value of the Vector the higher its momentum.
*Please note: At the time of publication Vlad Karpel does have a position in the featured symbol, fb. Our featured symbol is part of your free subscription service. Not included in any paid Tradespoon subscription service. Vlad Karpel only trades his money in paid subscription services. If you are a paid subscriber, please review your Premium Member Picks, ActiveTrader, or MonthlyTrader recommendations. If you are interested in receiving Vlad’s picks, please click here.
Oil
West Texas Intermediate for Crude Oil delivery (CL.1) is priced at $80.84 per barrel, down 0.05% at the time of publication.
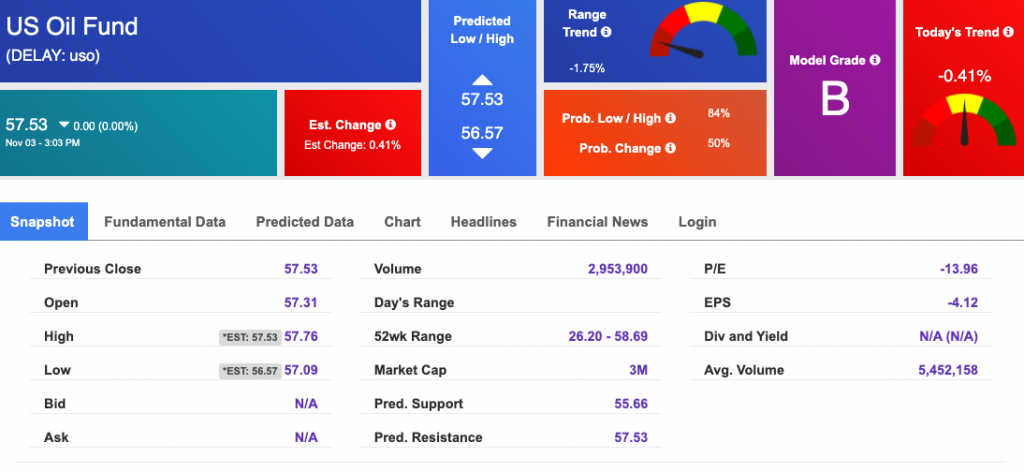
Looking at USO, a crude oil tracker, our 10-day prediction model shows mixed signals. The fund is trading at $57.53 at the time of publication. Prediction data uploaded after the market close at 6 p.m., CST. Today’s data is based on market signals from the previous trading session.
Gold
The price for the Gold Continuous Contract (GC00) is down 0.05% at $18265.60 at the time of publication.
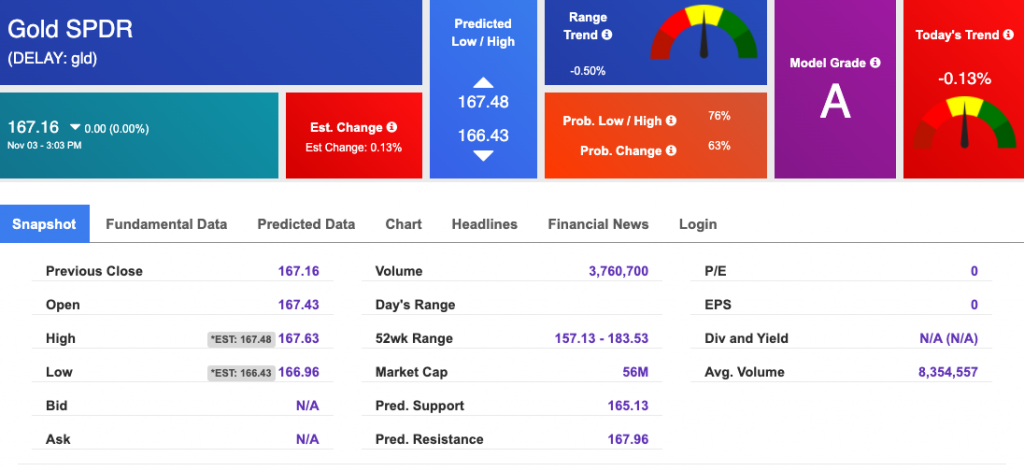
Using SPDR GOLD TRUST (GLD) as a tracker in our Stock Forecast Tool, the 10-day prediction window shows mixed signals. The gold proxy is trading at $167.16 at the time of publication. Vector signals show -0.13% for today. Prediction data uploaded after the market close at 6 p.m., CST. Today’s data is based on market signals from the previous trading session.
Treasuries
The yield on the 10-year Treasury note is up, at 1.622% at the time of publication.
The yield on the 30-year Treasury note is flat, at 1.997% at the time of publication.
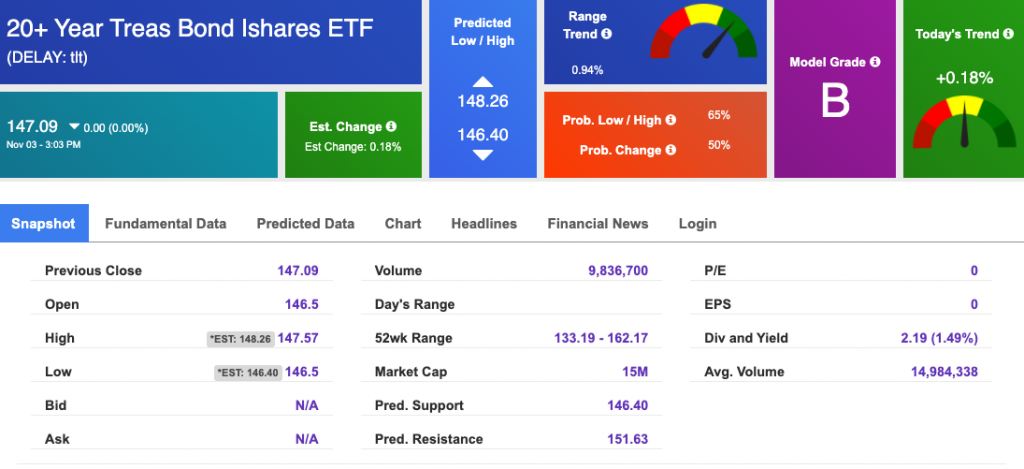
Using the iShares 20+ Year Treasury Bond ETF (TLT) as a proxy for bond prices in our Stock Forecast Tool, we see mixed signals in our 10-day prediction window. Prediction data uploaded after the market close at 6 p.m., CST. Today’s data is based on market signals from the previous trading session.
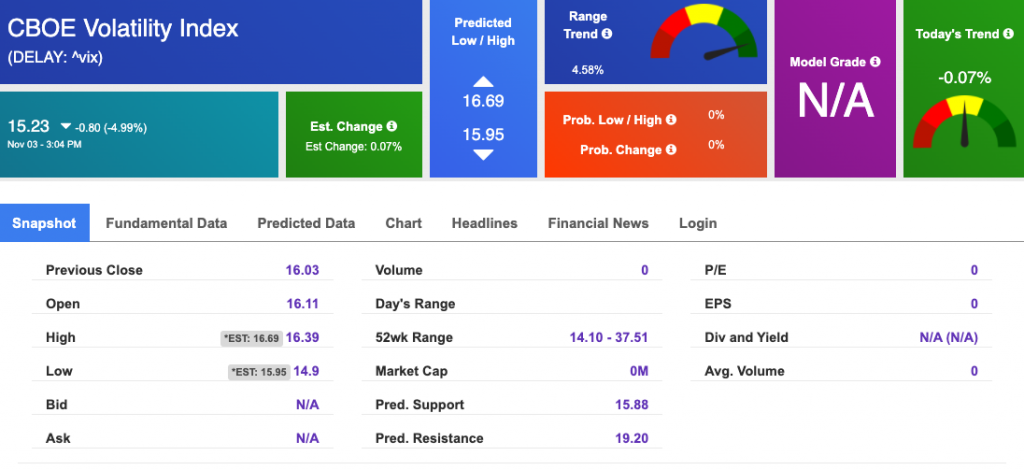
Volatility
The CBOE Volatility Index (^VIX) is $15.23 at the time of publication, and our 10-day prediction window shows mixed signals. Prediction data uploaded after the market close at 6 p.m., CST. Today’s data is based on market signals from the previous trading session.