U.S. Markets Trade Lower Following First Omicron Case in the States
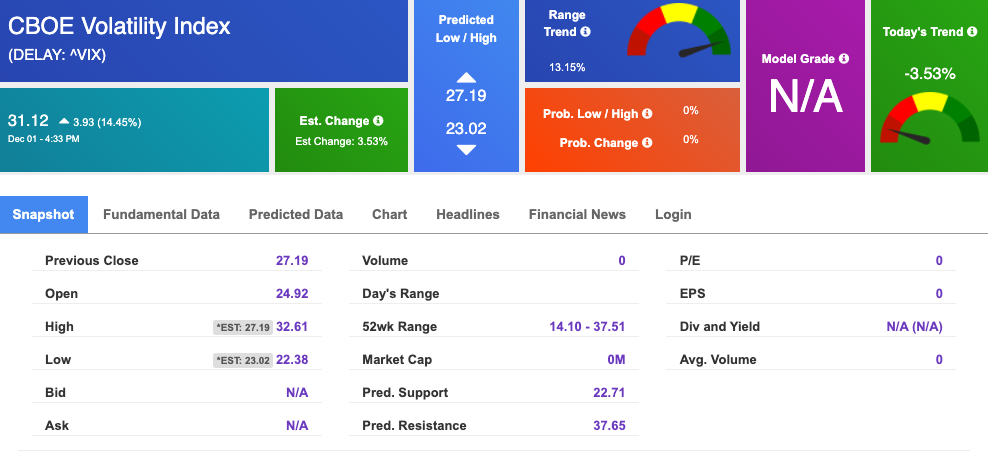
The $VIX has reached an extreme level, $30. All three major U.S. indices traded lower today after news of the first omicron variant of the coronavirus being diagnosed in California. Omicron virus, fear of runaway inflation, and November unemployment numbers can impact the next move in the market. NTAP, CRM, and ZS are key earnings announcements this week that can potentially influence the market direction. While some symbols saw intra-day peaks, news of the omicron variant reversed the recent gains. Additionally, hawkish comments from Fed Chair Jerome Powell also provided some pressure and concern regarding the latest variant’s impact on the market going forward.
November’s monthly labor report provided some support with 534,000 private-sector jobs added in the latest report, above expectations and October’s total. The latest Beige Book was released today and showed the U.S. economy has been growing at a moderate pace while prices surged rapidly across several sectors. Another key takeaway from the Beige Book showed supply chain disruptions and labor shortages, in part, stunted growth in the last two months. However, manufacturing data remained solid. The CBOE Volatility Index, also known as the “fear index” or “vix,” rose more than 13%. Technology stocks were among the worst hit with Facebook down 5% while Amazon, Google, and Netflix were also in the red. Travel restrictions and developments regarding the omicron should continue to influence markets as the year winds down. Globally, both European and Asian markets closed in the green impressively.
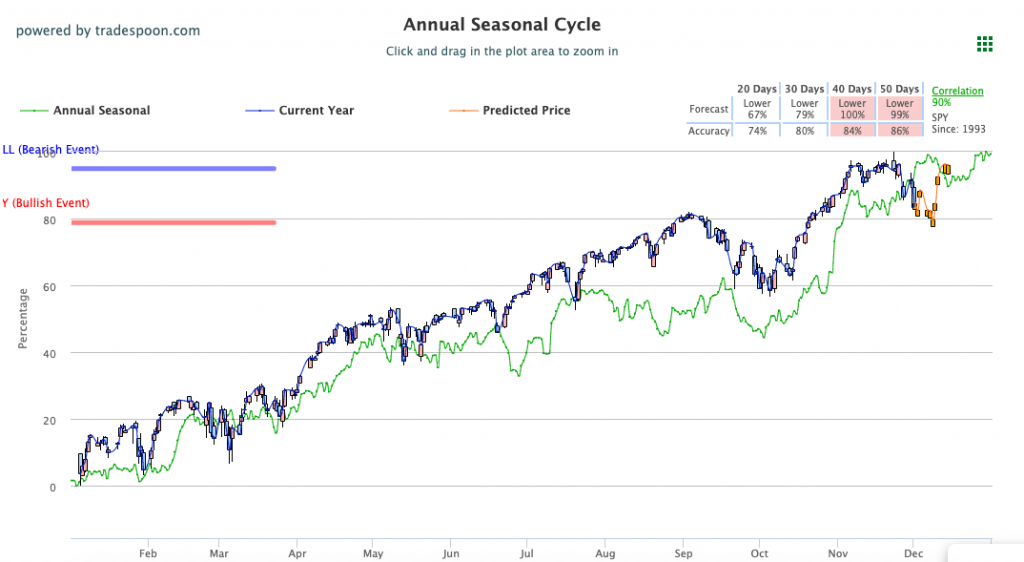
Critical support levels on the SPY at $452 and then at $445
Please watch the critical support levels on the SPY at $452 and then at $445 (a high probability event at this point) as we do expect the market to pull back in the next two weeks and then rebound toward the end of December. We encourage all market commentary readers to maintain clearly defined stop levels for all positions. For reference, the SPY Seasonal Chart is shown below:

Key U.S. Economic Reports/Events This Week:
- ADP Employment Report (November) – Wednesday
- Beige Book – Wednesday
- Weekly Jobless Claims (11/27) – Thursday
- Unemployment Rate (November) – Friday
- Average Hourly Earnings (November) – Friday
- Markit Services PMI (November) – Friday
- ISM Services Index (November) – Friday
- Factory Orders (October) – Friday
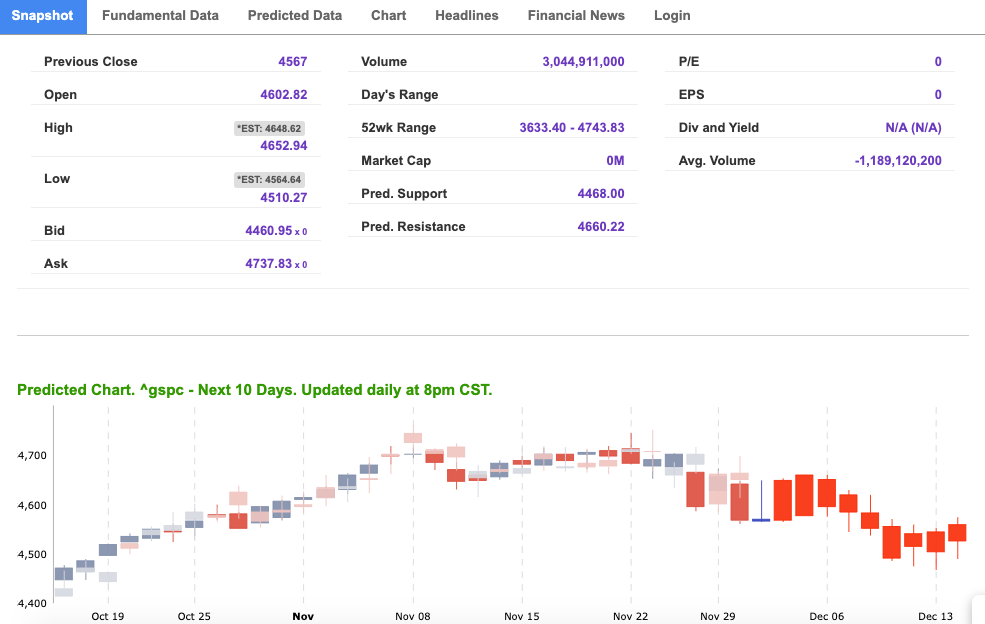
For reference, the S&P 10-Day Forecast is shown below:

Using the “^GSPC” symbol to analyze the S&P 500 our 10-day prediction window shows a near-term mixed outlook. Prediction data uploaded after the market closes at 6 p.m. CST. Today’s data is based on market signals from the previous trading session.
Vlad’s Portfolio Lifetime Membership!
DO AS I DO… AS I DO IT WATCH LIVE AS I WORK THE MARKETS! TRY IT NOW RISK-FREE!
Click Here to Sign Up
Thursday Morning Featured Symbol

Our featured symbol for Thursday is JPMorgan Chase (JPM). JPM is showing a steady vector in our Stock Forecast Toolbox’s 10-day forecast.
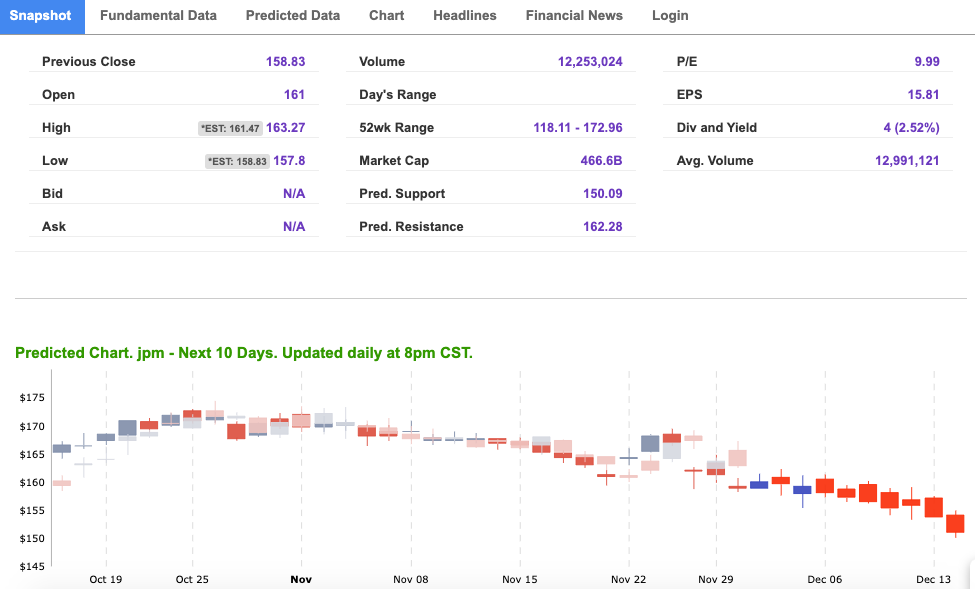
The symbol is trading at $157.89 with a vector of -0.59% at the time of publication.
10-Day Prediction data uploaded after the market close at 6 p.m., CST. Today’s data is based on market signals from the previous trading session.
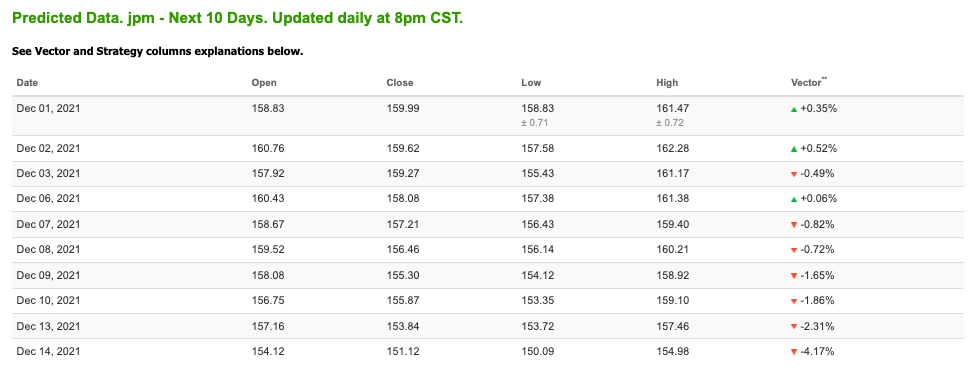
Note: The Vector column calculates the change of the Forecasted Average Price for the next trading session relative to the average of actual prices for the last trading session. The column shows the expected average price movement “Up or Down”, in percent. Trend traders should trade along the predicted direction of the Vector. The higher the value of the Vector the higher its momentum.
*Please note: At the time of publication Vlad Karpel does have a position in the featured symbol, JPM. Our featured symbol is part of your free subscription service. Not included in any paid Tradespoon subscription service. Vlad Karpel only trades his money in paid subscription services. If you are a paid subscriber, please review your Premium Member Picks, ActiveTrader, or MonthlyTrader recommendations. If you are interested in receiving Vlad’s picks, please click here.
Oil
West Texas Intermediate for Crude Oil delivery (CL.1) is priced at $65.70 per barrel, down 0.73% at the time of publication.
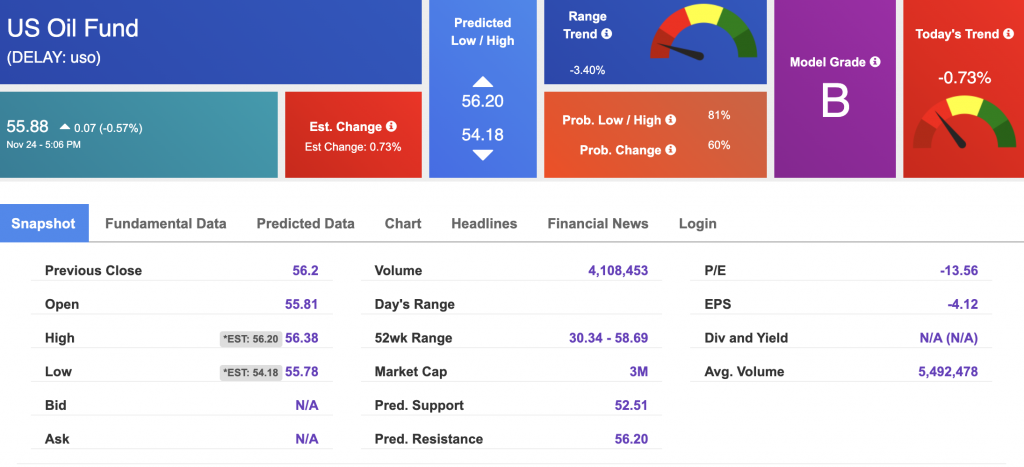
Looking at USO, a crude oil tracker, our 10-day prediction model shows mixed signals. The fund is trading at $55.88 at the time of publication. Prediction data uploaded after the market close at 6 p.m., CST. Today’s data is based on market signals from the previous trading session.
Gold
The price for the Gold Continuous Contract (GC00) is up 0.37% at $1783.10 at the time of publication.
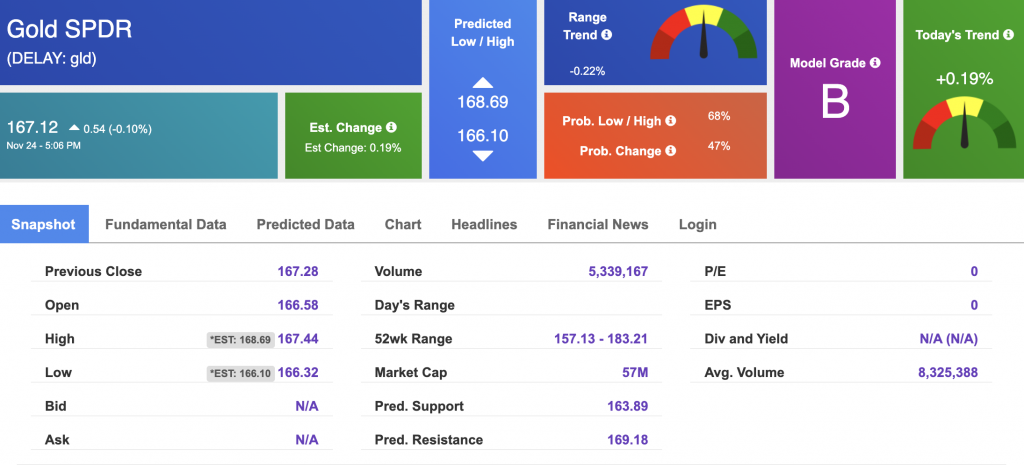
Using SPDR GOLD TRUST (GLD) as a tracker in our Stock Forecast Tool, the 10-day prediction window shows mixed signals. The gold proxy is trading at $167.12 at the time of publication. Vector signals show +0.19% for today. Prediction data uploaded after the market close at 6 p.m., CST. Today’s data is based on market signals from the previous trading session.
Treasuries
The yield on the 10-year Treasury note is down, at 1.408% at the time of publication.
The yield on the 30-year Treasury note is down, at 1.745% at the time of publication.
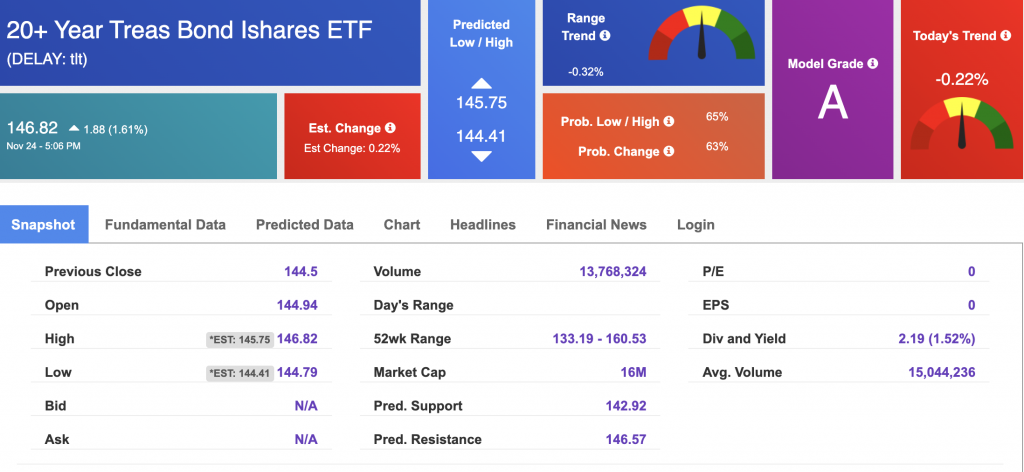
Using the iShares 20+ Year Treasury Bond ETF (TLT) as a proxy for bond prices in our Stock Forecast Tool, we see mixed signals in our 10-day prediction window. Prediction data is uploaded after the market close at 6 p.m., CST. Today’s data is based on market signals from the previous trading session.
Volatility
The CBOE Volatility Index (^VIX) is $31.12 at the time of publication, and our 10-day prediction window shows mixed signals. Prediction data uploaded after the market close at 6 p.m., CST. Today’s data is based on market signals from the previous trading session.
