U.S. Stocks Turn Red in Final Hour, Powell in D.C.
Continued coronavirus fears are once more impacting markets
After trading higher for several sessions, including earlier today, U.S. stocks traded lower to close the day. Both the Dow and S&P saw gains turn red in the final hour of trading while the Nasdaq held on to modest gains. Continued coronavirus fears are once more impacting markets both in the U.S., with several states reporting an increase of cases, and overseas.
Retail sales data for last month showed an increase of 17.7%
Fed Chair Powell concluded his two-day testimony in D.C. today providing additional details on the virus’s economic impact as well as the Fed’s mindset going forward. Retail sales data for last month showed an increase of 17.7% following a stark decline of 16% in April, similarly, the latest housing-starts report also showed an increase of 4% last month.
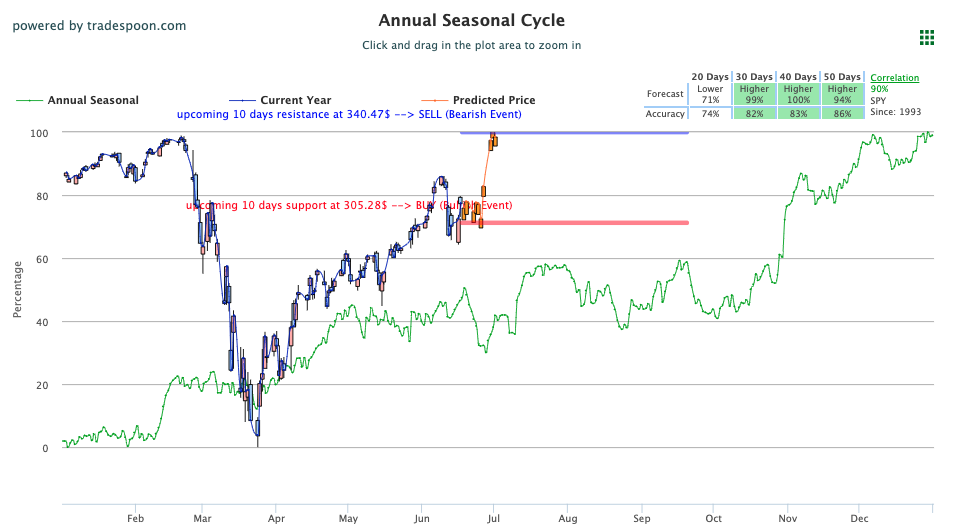
Our models are projecting the SPY to trade between $270-$330 level in the next 2-3 weeks and we believe the market is unlikely to retest $260 SPY level at this time. We will continue monitoring the VIX as the market can overshoot support and resistance levels when VIX is trading near $30 level. In the short term, we will be buyers into any corrections and it is our opinion the market is still overbought. Short-term traders should consider adding to positions when SPY near $293 and reducing exposure to the market at $320. SPY remains above $300 today and aggressive traders can consider adding to their positions until the market reaches $320 level. As always, investors should consider hedging portfolios into the rallies and Market Commentary readers are encouraged to maintain clearly defined stop-levels for all positions. For reference, the SPY Seasonal Chart is shown below:

Today, the Dow and S&P closed lower, down 0.64% and 0.36% respectively, while the Nasdaq reported gains of 0.15%. Globally, both Asian and European markets closed to mixed results. Oil moved lower while Gold saw modest gains. The dollar edged higher and long-term U.S. Treasury notes saw yields lower.
Key U.S. Economic Reports/Events This Week
- Lead Economic Indicators ( May) – Thursday
- Weekly Jobless Claims (6/13) – Thursday
- Current Account Deficit (Q1) – Friday
(Want free training resources? Check our our training section for videos and tips!)
Key Corporate Earnings Out This Week
- SWBI – Smith & Wesson Brands – Thursday, June 18th
- KMX – CarMax – Friday, June 19th
- JBL – Jabil- Friday, June 19th
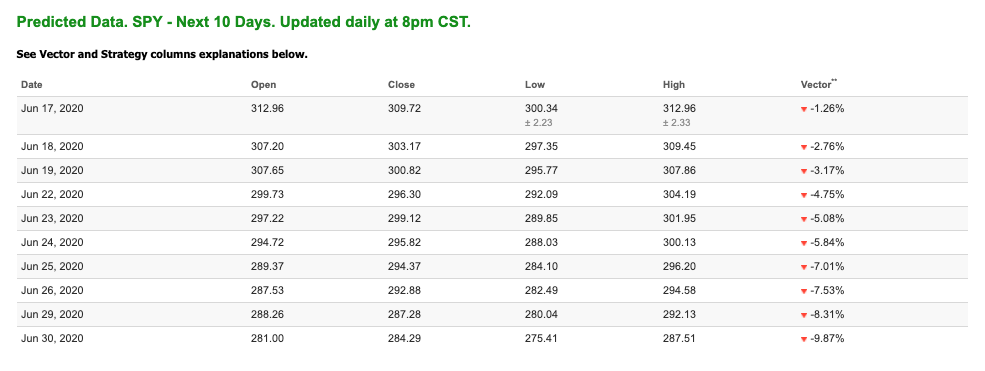
For reference, the S&P 10-Day Forecast is shown below:
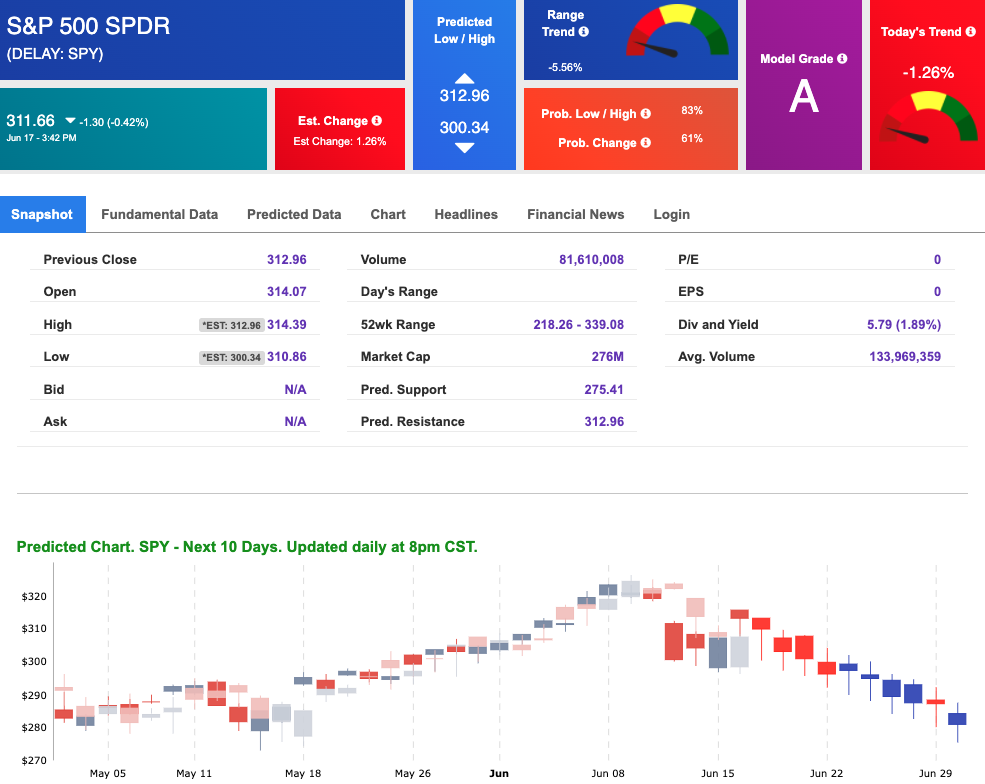
Using the “^GSPC” symbol to analyze the S&P 500 our 10-day prediction window shows a near-term mixed outlook. Prediction data is uploaded after the market closes at 6 p.m. CST. Today’s data is based on market signals from the previous trading session.
Vlad’s Portfolio Lifetime Membership!
DO AS I DO… AS I DO IT WATCH LIVE AS I WORK THE MARKETS! TRY IT NOW RISK-FREE!
Click Here to Sign Up
Highlight of a Winning Trade
On May 28th, our ActiveTrader service produced a bullish recommendation for Texas Instruments (TXN). ActiveTrader is included in several Tradespoon membership plans and is designed for day trading, with signals meant to last for 1-2 days.
Trade Breakdown
TXN entered its forecasted Strategy B Entry 1 price range $117.82(± 0.88) in the first hour of trading that day and passed through its Target price of $119.00. The Stop Loss price was set at $116.64.

Thursday Morning Featured Symbol
Our featured symbol for Thursday is JPMorgan Chase & Company (JPM). JPM is showing a steady vector in our Stock Forecast Toolbox’s 10-day forecast. This stock is assigned a Model Grade of (A) indicating it ranks in the top 10th percentile for accuracy for current-day predicted support and resistance, relative to our entire data universe.
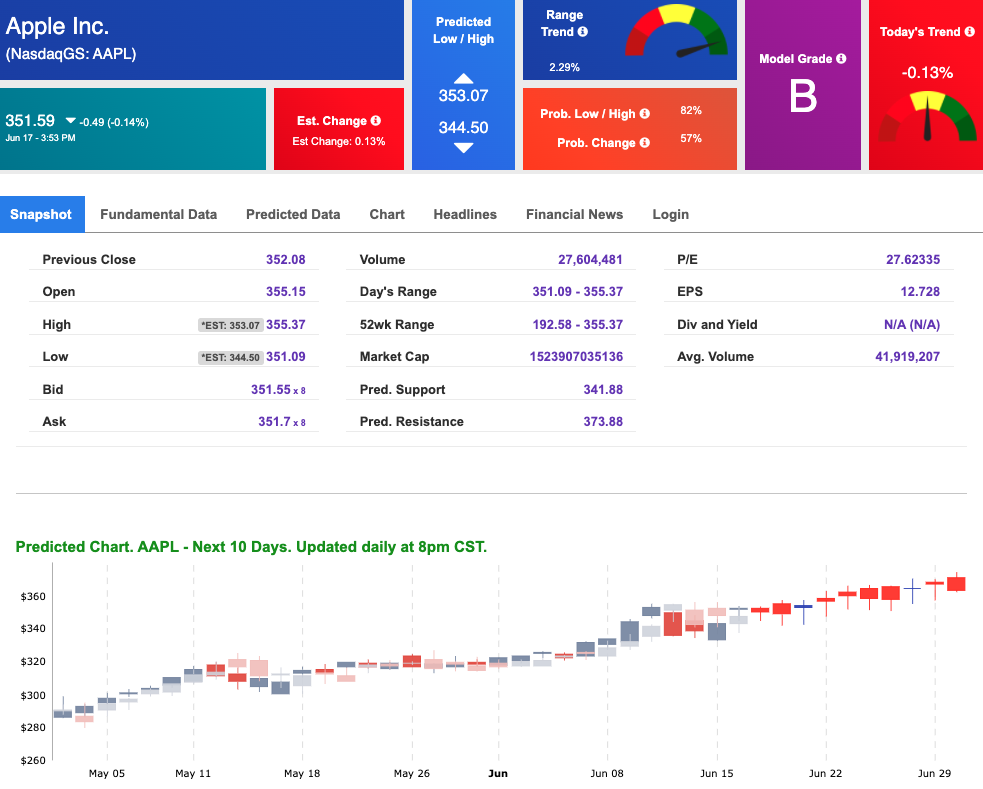
The stock is trading at $351.59, with a vector of -0.13% at the time of publication.
Prediction data is uploaded after the market close at 6 p.m., CST. Today’s data is based on market signals from the previous trading session.
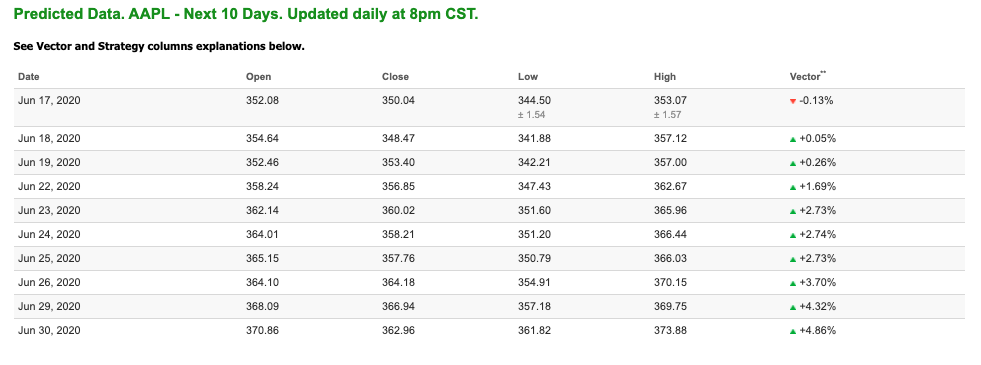
Note: The Vector column calculates the change of the Forecasted Average Price for the next trading session relative to the average of actual prices for the last trading session. The column shows the expected average price movement “Up or Down”, in percent. Trend traders should trade along the predicted direction of the Vector. The higher the value of the Vector the higher its momentum.
*Please note: At the time of publication Vlad Karpel does have a position in the featured symbol, AAPL. Our featured symbol is part of your free subscription service. It is not included in any paid Tradespoon subscription service. Vlad Karpel only trades his money in paid subscription services. If you are a paid subscriber, please review your Premium Member Picks, ActiveTrader, or MonthlyTrader recommendations. If you are interested in receiving Vlad’s picks, please click here.
Oil
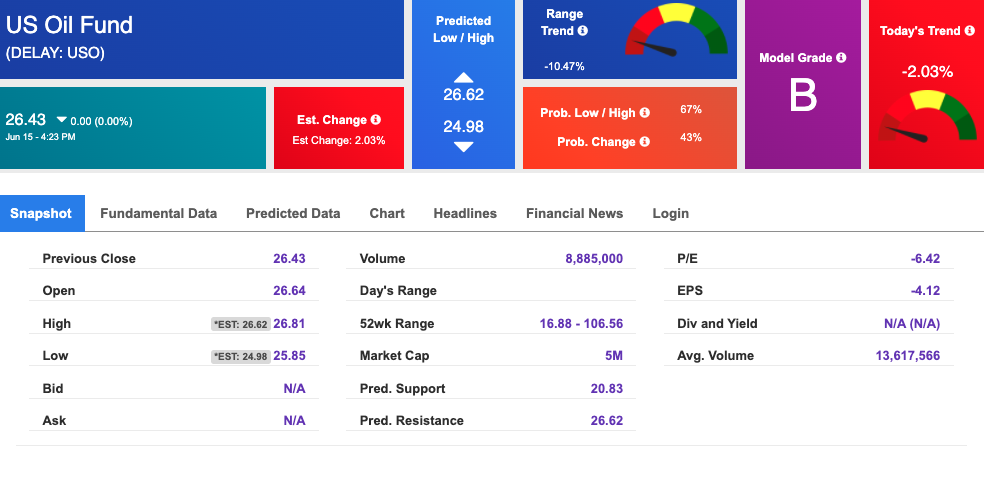
West Texas Intermediate for Crude Oil delivery (CL.1) is priced at $37.70 per barrel, down 1.77% from the open, at the time of publication.
Looking at USO, a crude oil tracker, our 10-day prediction model shows mixed signals. The fund is trading at $26.43 at the time of publication. Prediction data is uploaded after the market close at 6 p.m., CST. Today’s data is based on market signals from the previous trading session.
Gold
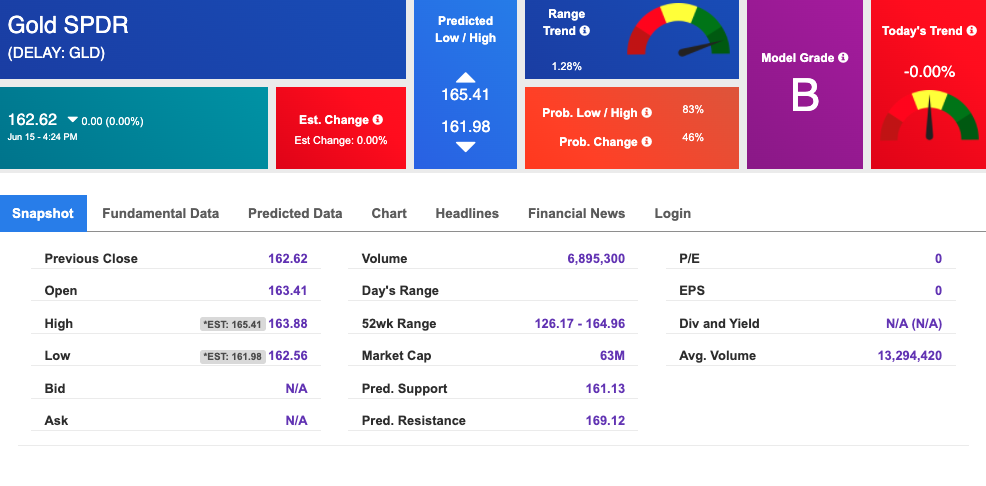
The price for the Gold Continuous Contract (GC00) is down 0.06% at $1,735.50 at the time of publication.
Using SPDR GOLD TRUST (GLD) as a tracker in our Stock Forecast Tool, the 10-day prediction window shows mixed signals. The gold proxy is trading at $162.62, at the time of publication. Vector signals show 0.00% for today. Prediction data is uploaded after the market close at 6 p.m., CST. Today’s data is based on market signals from the previous trading session.
Treasuries
The yield on the 10-year Treasury note is down, at 0.733% at the time of publication.
The yield on the 30-year Treasury note is down, at 1.532% at the time of publication.
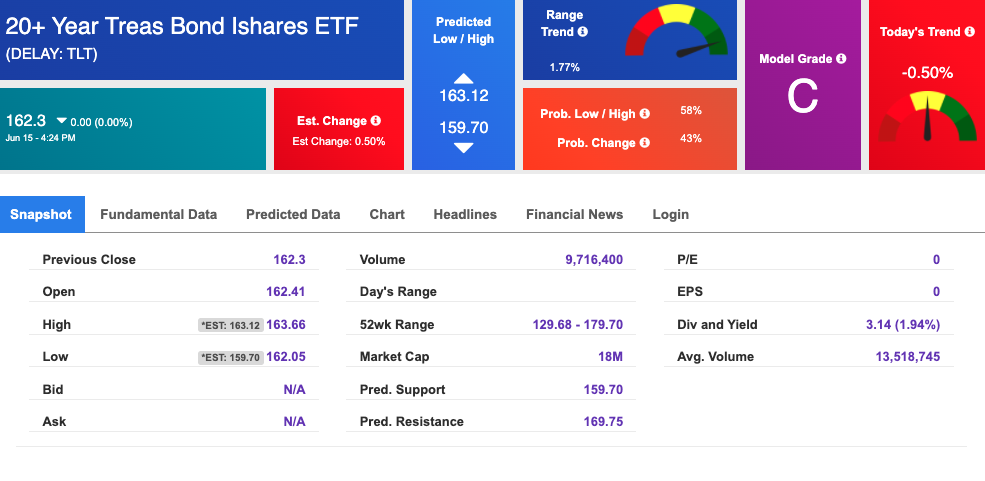
Using the iShares 20+ Year Treasury Bond ETF (TLT) as a proxy for bond prices in our Stock Forecast Tool, we see mixed signals in our 10-day prediction window. Prediction data is uploaded after the market close at 6 p.m., CST. Today’s data is based on market signals from the previous trading session.
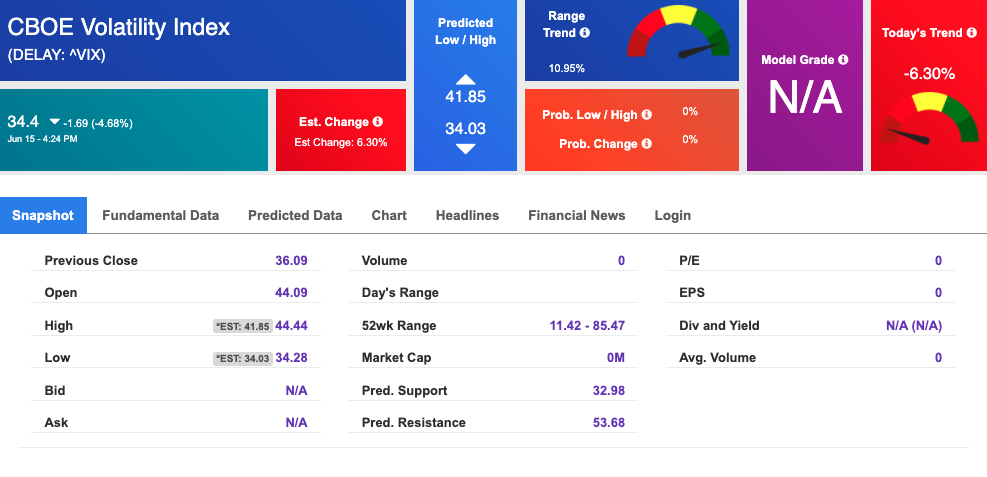
Volatility
The CBOE Volatility Index (^VIX) is $34.4 at the time of publication, and our 10-day prediction window shows mixed signals. Prediction data is uploaded after the market close at 6 p.m., CST. Today’s data is based on market signals from the previous trading session.