
Volatility Closes Below 15
- The march to higher highs continues to keep the Nasdaq and the S&P in overbought territory with the relative strength index (RSI) levels for the indexes at 75 and 76, respectively. The 70 level is considered overbought and has been in play since late June with a brief dip into the mid 60’s earlier this month for both indexes.
- There hasn’t been a 1% move in the S&P since June 24th, or 22 trading sessions. The Nasdaq has gone 15 sessions without a 1% change but has come close with a few 0.9% up and down pops. When this starts to change, to the downside, it could start to signal near-term tops for both indexes.
- The results thus far for the second-quarter earnings season is coming in well above Wall Street’s expectations. Of the companies that have announced, 83% have topped estimates while exceeding expectations by 7%. This has pushed the S&P 500 earnings growth rate for the quarter to 5.5%, up from 4% just a few weeks ago.
The major indexes showed ongoing strength Friday as the bulls pushed another round of record highs while volatility closed below a key level of support. The weekly gains come as the heart of the 2Q earnings season takes center stage with a number of key Tech companies reporting numbers this upcoming week.
The Nasdaq traded to a lifetime high of 21,159r- before ending at 21,108 (+0.2%). Undefined resistance at 21,250-21,500 held. Support is at 20,750.
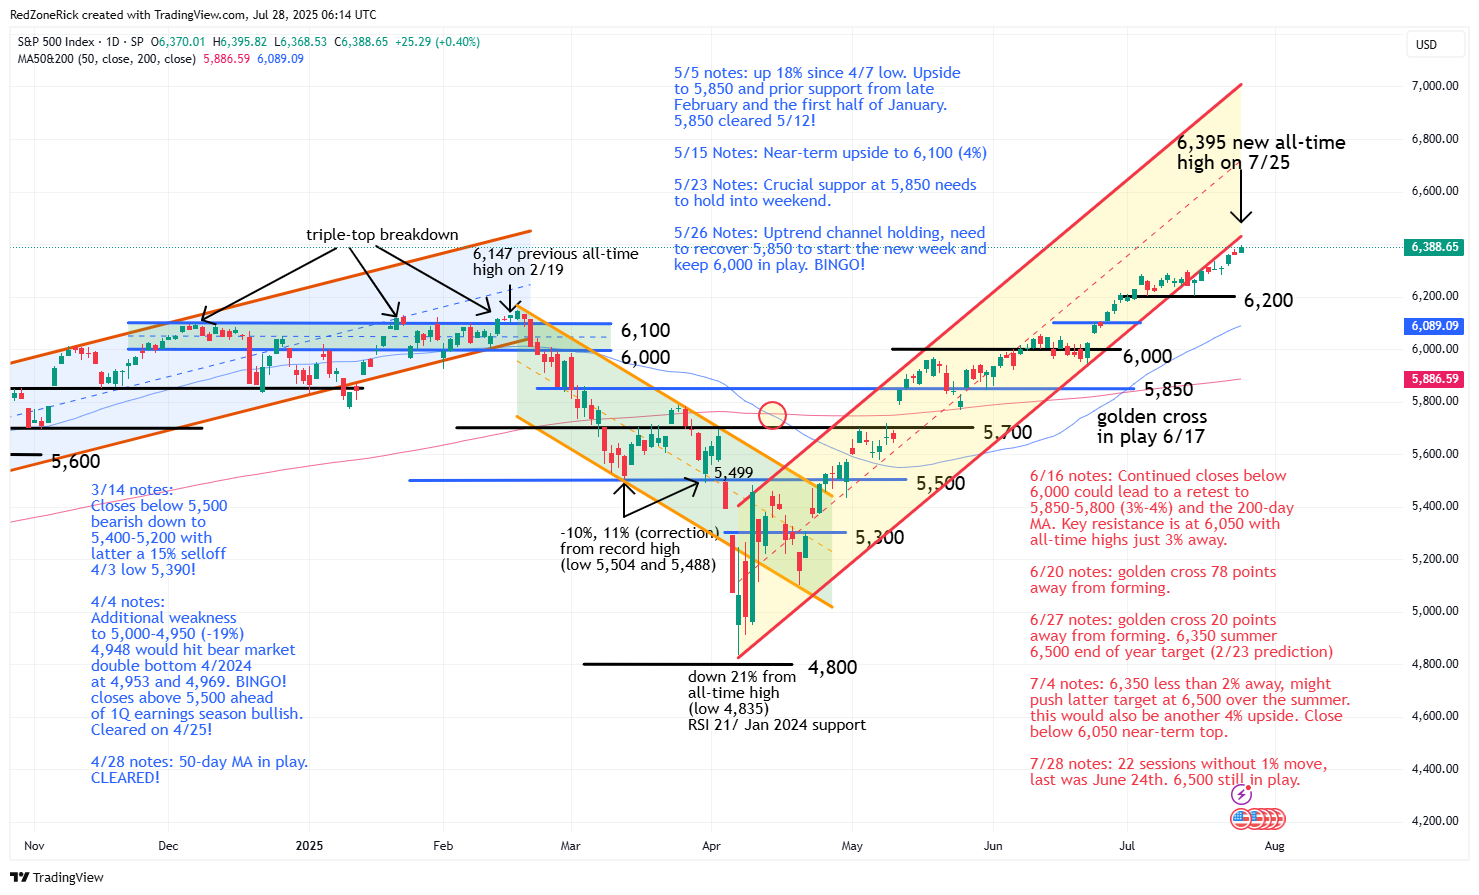
The S&P 500 closed at 6,388 (+0.4%) with the record peak reaching 6,395. Fresh resistance at 6,400 held. Rising support is at 6,300.
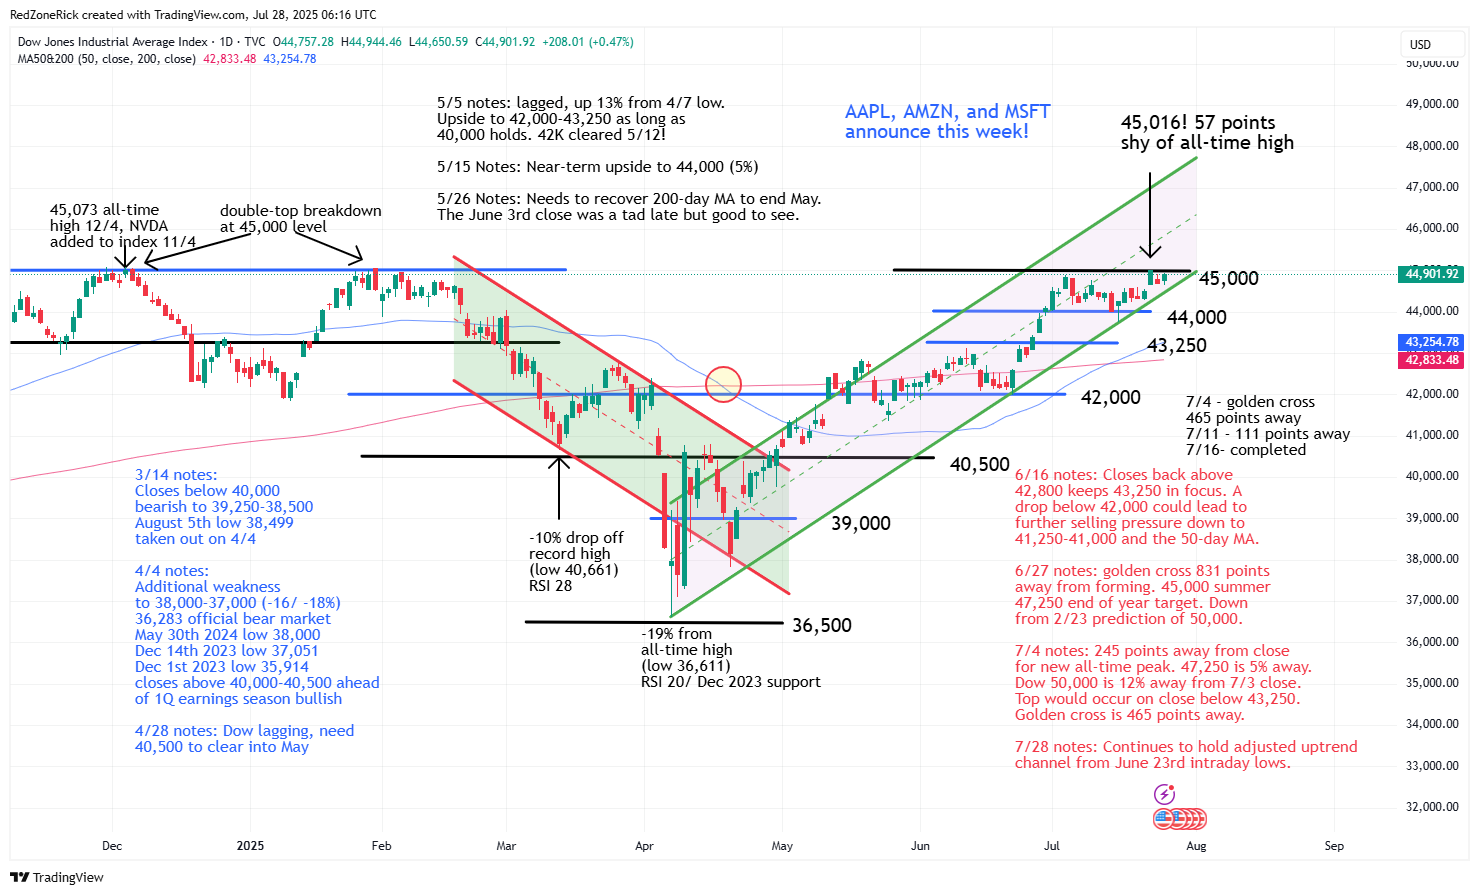
The Dow tested a high of 44,944 while finishing at 44,901 (+0.5%). Key resistance at 45,000 held. Support is at 44,500.
Earnings and Economic News
Before the open: Bank of Hawaii (BOH), New Gold (NGD), Rithm Capital (RITM)
After the close: Cadence Design Systems (CDNS), Celestica (CLS), Rambus (RMBS), Whirlpool (WHR), WM (WM)
Economic News
None
Technical Outlook and Market Thoughts
For the week, the Nasdaq rose 1% and the S&P gained 1.5%. The Dow was up 1.3% while the Russell climbed 0.9%. Year-to-date, the Nasdaq has rallied 9.3% while the S&P has jumped 8.6%. The Dow is higher by 5.5% and the Russell has added 31 points, or 1.3%.
The march to higher highs continues to keep the Nasdaq and the S&P in overbought territory with the (RSI) relative strength index levels for the indexes at 75 and 76, respectively. The 70 level is considered overbought and has been in play since late June with a brief dip into the mid 60’s earlier this month for both indexes.
We have talked about overbought levels staying in play for weeks and possibly months so this isn’t alarming news, just something to continue to watch. On the other hand, the RSI levels for the Dow and the Russell are at 63 and 61, respectively. We think there is a chance both indexes outperform the Nasdaq and the S&P to close out the summer with a run at 70 coming on fresh breakouts.
There hasn’t been a 1% move in the S&P since June 24th, or 22 trading sessions. The Nasdaq has gone 15 sessions without a 1% change but has come close with a few 0.9% up and down pops and drops. When this starts to change, to the downside, it could start to signal near-term tops for both indexes.
The Nasdaq fell out of its uptrend channel on July 16th but has made higher highs. If the uptrend lines were adjusted off the intraday lows, the index would still be hugging the bottom of this channel. There is still upside towards 21,250-21,500 on continued strength. Our summertime target is at 21,500 and our January 22nd target prediction for the Nasdaq is at 22,000 by yearend.
Rising support is 21,000-20,750. A close below 20,500 could lead to further weakness down to 20,100-20,000 and would suggest a near-term top for the index.

The S&P 500 fell out of its uptrend channel a day earlier than the Nasdaq on July 15th but has also trudged higher. The index would solidly be back in its uptrend channel if the lines were redrawn off the July 16th intraday low, as well. Our near-term summertime price-targets are at 6,350-6,500 for the index with the former already tripping.
Support has moved up to 6,300. A close back below 6,200 would be a bearish development with risk down to 6,100 and the 50-day moving average.
The Russell 2000 ended above key resistance at 2,275 on Wednesday but made lower lows afterwards to close out the week. This is why we always say to confirm follow thru action. The index is still holding its adjusted uptrend channel off the April 9th, the June 23rd, and the July 16th lows. Continued closes above 2,275 keeps gets 2,300-2,325 in focus with our near-term Price Target for the index at 2,375.
Support is at 2,250-2,225. A close below 2,175-2,150 and the 200-day and 50-day moving averages would be a slightly bearish signal. A golden cross is now just 22 points away from forming.

The Dow battled key resistance at 45,000 to close out last week while missing a fresh all-time high by 57 points. The index is on the verge of a triple-top breakout, or breakdown, that will likely come on this week’s action. Our near-term Price Target for the index remains at 47,250 on a breakout above 45,000. A golden cross formed mid-month in the blue-chips and is still suggesting higher highs.
Support has moved up to 44,500-44,250. Another drop below 44,000 and the July 16th low at 43,758 likely gets 43,250 and the 50-day moving average in play.
The Volatility Index (VIX) closed below crucial support at 15 on Friday and represents just the third close below this level for the year. We predicted weakness down to 15-14.50 during earnings season with the market peaking at some point in August. The VIX could test 13.50-12.75 if 14.50 fails to hold.
Resistance is at 17.50-18 and the 50-day moving average. A close above 20 and the 200-day moving average would imply a near-term market top. The VIX has made it fairly simple to help figure out when the bears will start to attack.

The results thus far for the second-quarter earnings season is coming in well above Wall Street’s expectations. Of the companies that have announced, 83% have topped estimates while exceeding expectations by 7%. This has pushed the S&P 500 earnings growth rate for the quarter to 5.5%, up from 4% just a few weeks ago.
The upcoming week will be the busiest of the 2Q earnings season with nearly 40% of the S&P 500 companies reporting results. Several of the “Magnificent Seven” will be in the spotlight including Amazon (AMZN), Apple (APPL), Microsoft (MSFT) and Meta (META). The first three are all members of the Dow and why a pending breakout, or breakdown, for the index is in play this week.
As a reminder, the July 16th intraday support levels are at Nasdaq 20,500; S&P 6,200; Dow 44,000 and Russell 2,175. Until these levels crack, we remain bullish.