
Volatility Pushing Bulls to the Brink
A strong jobs report whacked Wall Street on Friday as 250,000 jobs were added last month. This was well above forecasts and could prompt the Fed to keep rates higher over the near-term. Meanwhile, volatility rose to a key level of resistance but held into the closing bell.
The biggest development from Friday’s action was the close below key support levels across the board for the major indexes. The Nasdaq and the S&P fell out of their uptrend channels to join the Dow and the Russell.
The overall pullback also pushed the major indexes into negative territory for the month and comes just ahead of the fourth-quarter earnings season that starts this week. We often talk about stretch at key support and resistance levels but the technical developments are starting to confirm a possible near-term top.
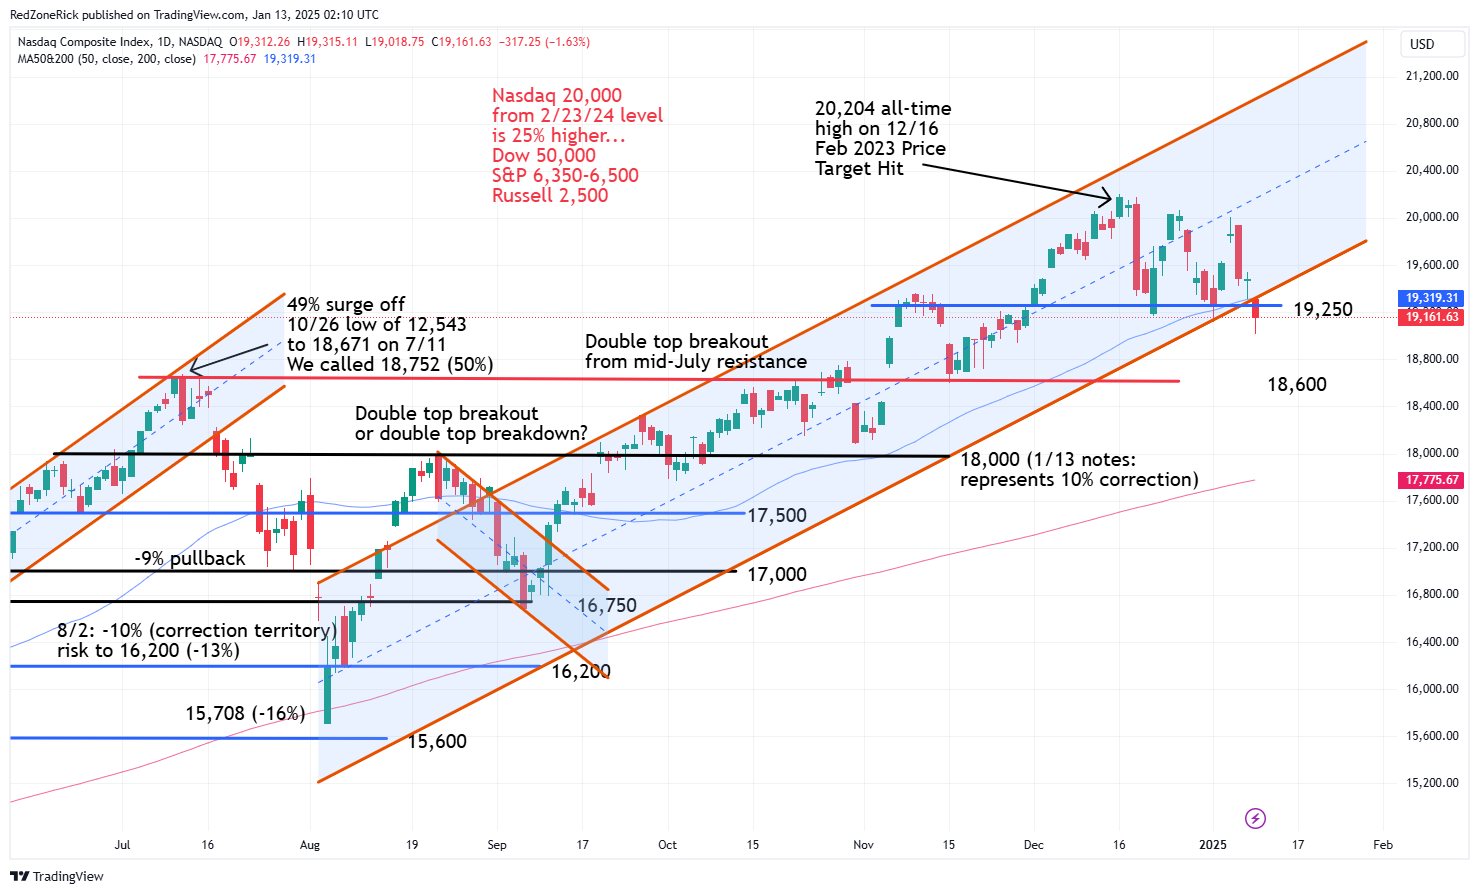
The Nasdaq closed below its 50-day moving average and below its current uptrend channel. While we have mentioned stretch down to 19,000, our chart continues to show further risk to 18,600, especially following the close below key support at 19,250. This level is now key resistance and the bears need to hold this level for at least Monday’s session, if not longer, to confirm further weakness. The next wave afterwards is at 18,000 and represents roughly a 10% correction from the all-time high at 20,204.
The bottom of the uptrend channel for Monday is roughly at 19,350 with closes above 19,500 being more bullish.
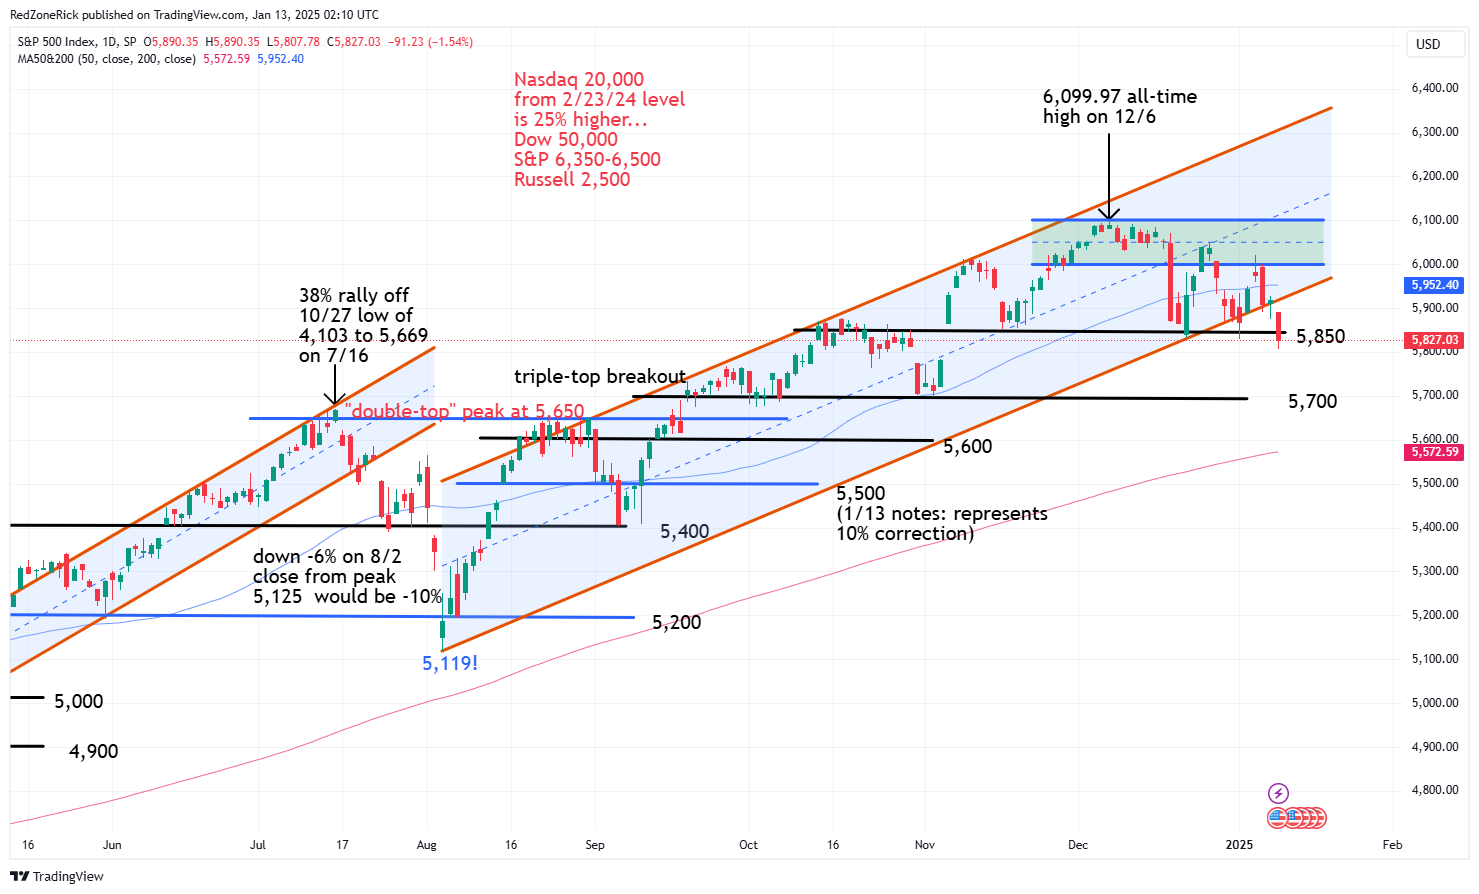
The S&P is also in the same position after failing out of its uptrend channel and failing key support at 5,850. This level had been holding since November 6th following the 2.5% surge off the 5,700 level. The index is down 5% from its all-time top near 6,100. The 5,500 level represents a 10% correction.
Closes above 5,900-5,950 to start the week would get the index back into its uptrend channel with the latter representing the 50-day moving average. We would wait until 6,000 is cleared and held before turning bullish on the S&P.
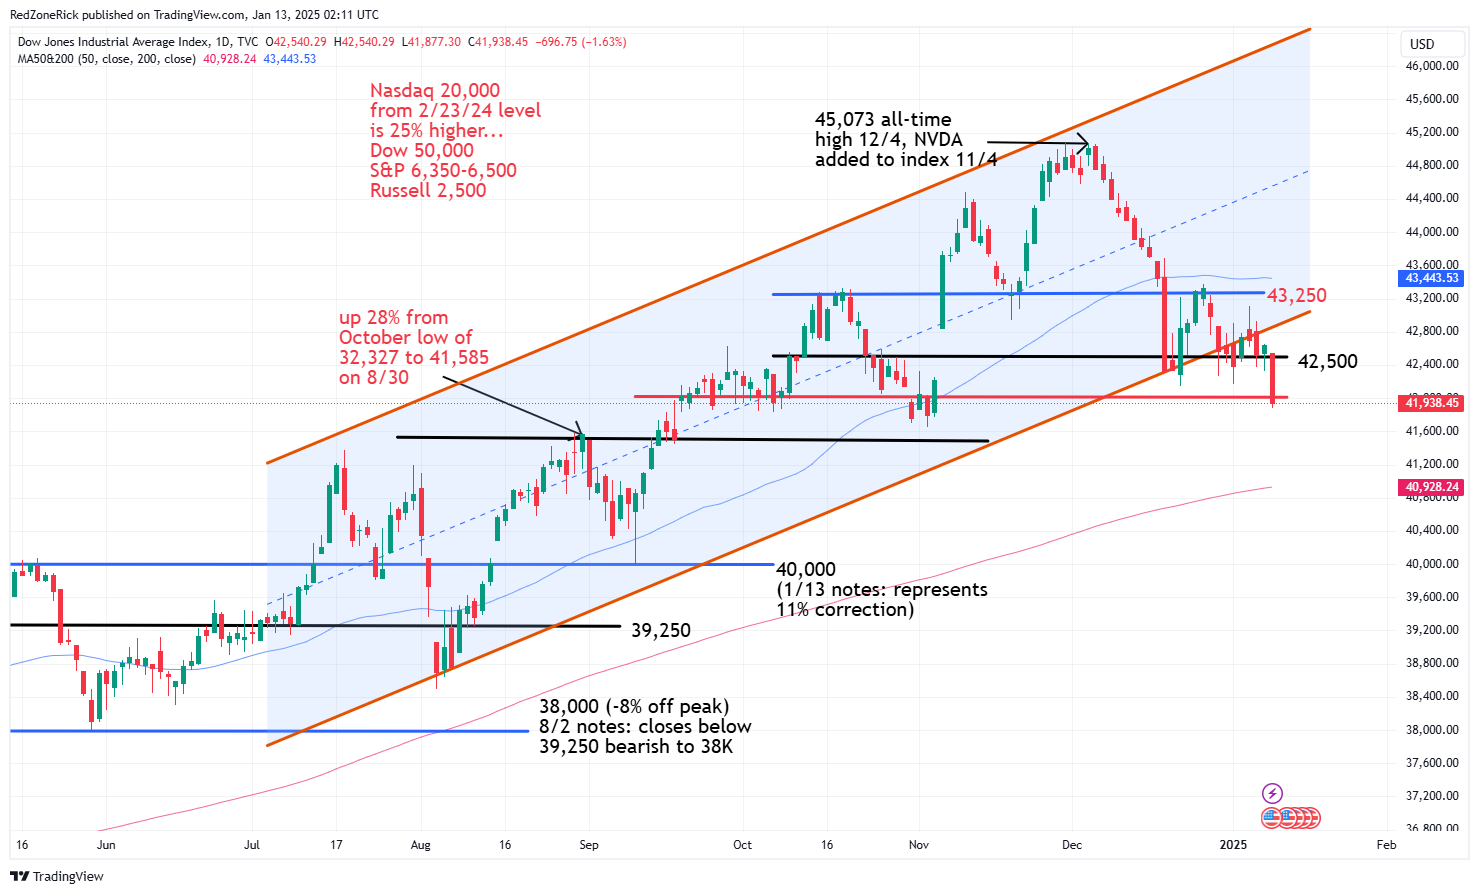
The Dow has settled outside of its uptrend channel over the past eight sessions and failed to hold backup support at 42,000. There is another layer of help at 41,500 for the bulls. However, if breached, there is big-time risk down to 40,000. If reached, it would represent an 11% selloff from the all-time peak north of 45,000 set back in early November.
Key resistance remains at 43,250 followed by 43,500 and the 50-day moving average. The bottom of the uptrend channel is near 43,000 for Monday’s session.
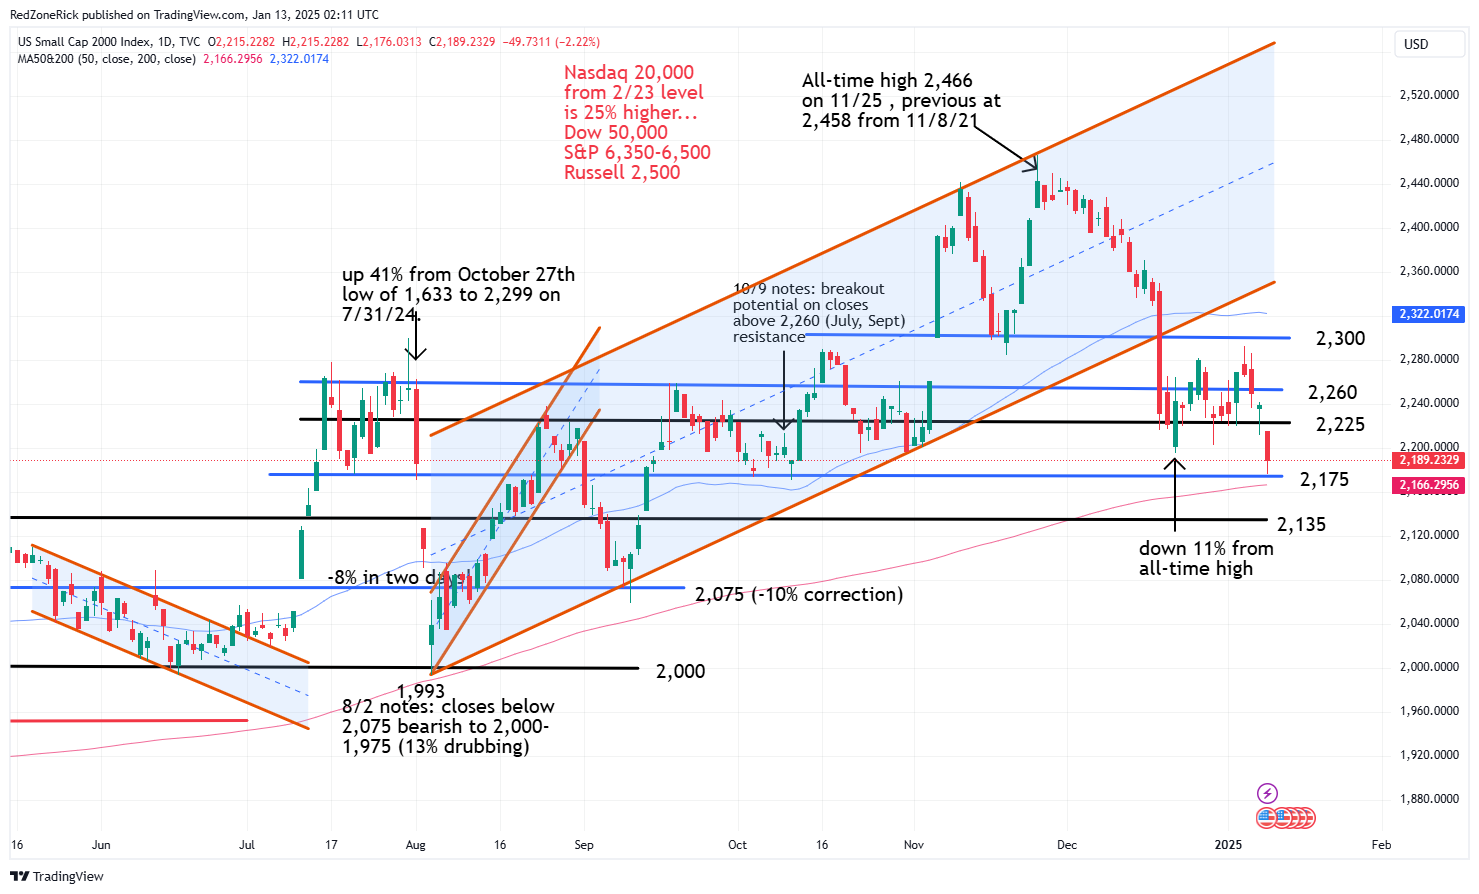
The Russell was hit the hardest on Friday after failing to hold key support at 2,225 and now key resistance. We have been highlighting 2,175 and 2,135 since the December 18th plunge of 4.4%. The 2,175 level has been holding since the September 13th breakout above the 2,135 level.
The small-caps are currently down 11% from the all-time high of 2,458 and in the same position from the intraday low of 2,194 on December 20th. The next waves of support we have been tracking are at 2,075 and 2,000. If reached, it would extend the losses to 16% and 19%, respectively.
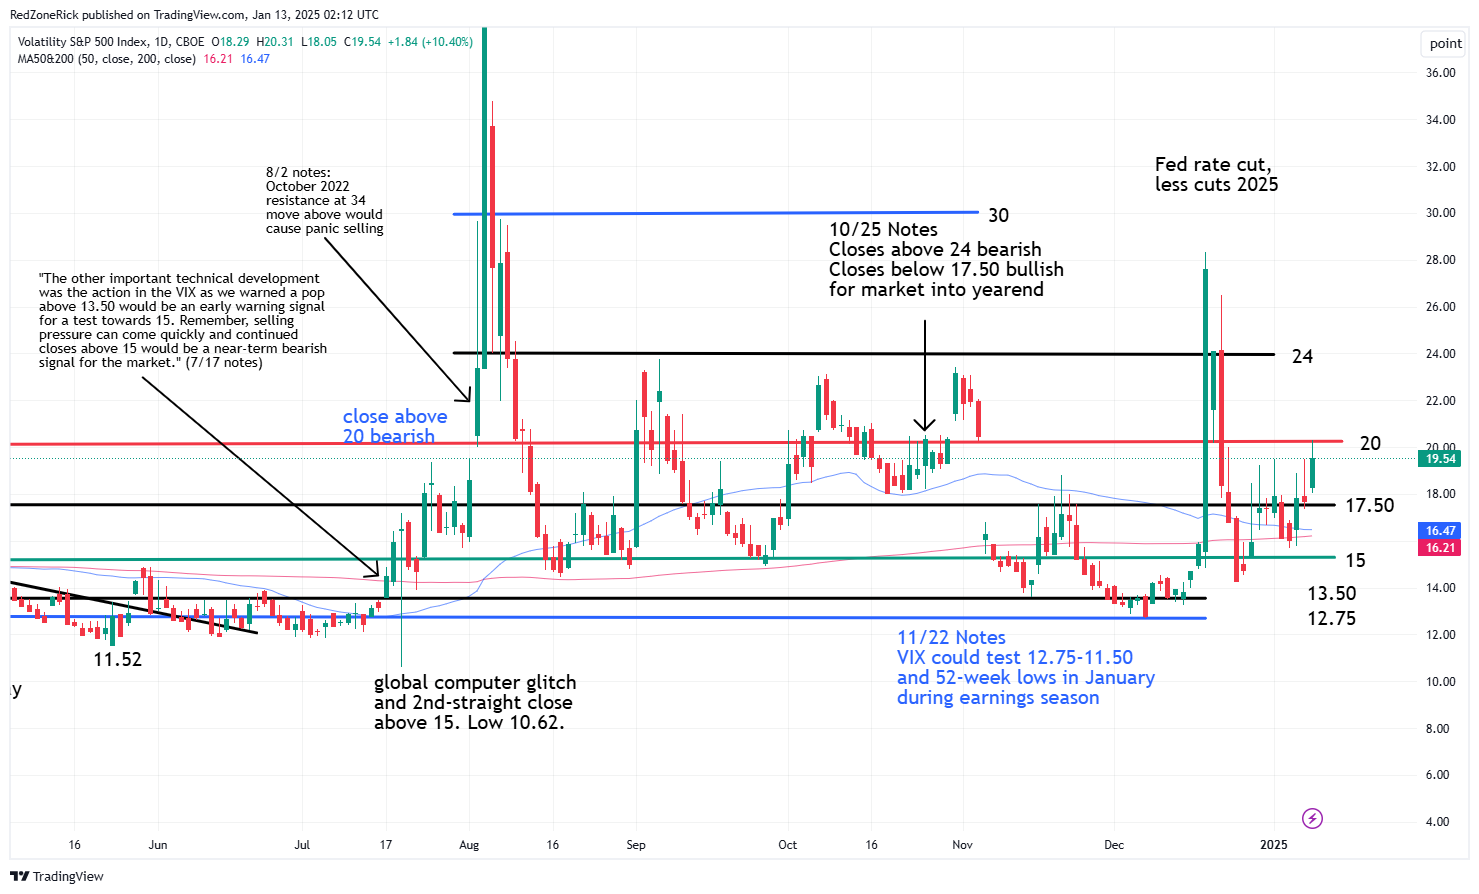
The Volatility Index (VIX) traded up to 20.31 while holding key resistance at 20 into the close. There is risk up to 24 and possibly 28-30 this week if the bears stay aggressive. The December 18th peak is at 28.32. The August 7th and 8th tops are at 29.76 and 29.47, respectively. The August 5th intraday peak is at 65.73.
The other developing concern for the VIX is that the 50-day moving average is now running parallel to the 200-day moving average. This puts in danger the possible death-cross that was in play for the VIX and typically confirms lower lows. A recovery of the 17.50 and 15 levels this week by the bulls would be a renewed bullish signal for the market.
We mentioned last Monday morning “when there is no Santa rally, January tends to be a bearish month for the market. If the month of January is negative, the market usually struggles to post a yearly gain. We always mention February is a tricky month to trade and why we are preparing for volatility at some point over the next few weeks and months.”
In 2024, it seems the bulls (and the algorithms) bought the dip throughout the entire year and what lead to the phenomenal gains. This week will be the first big test to see if bargain hunters step in to start the week.