

Watching the Dow Transports For Market Clues
Despite the choppiness, May turned out to be a very bullish month as the major indexes posted solid gains. With earnings season winding down, and volatility still slightly elevated, savvy traders are looking for clues to confirm a possible summer rally – or signs of a market top.
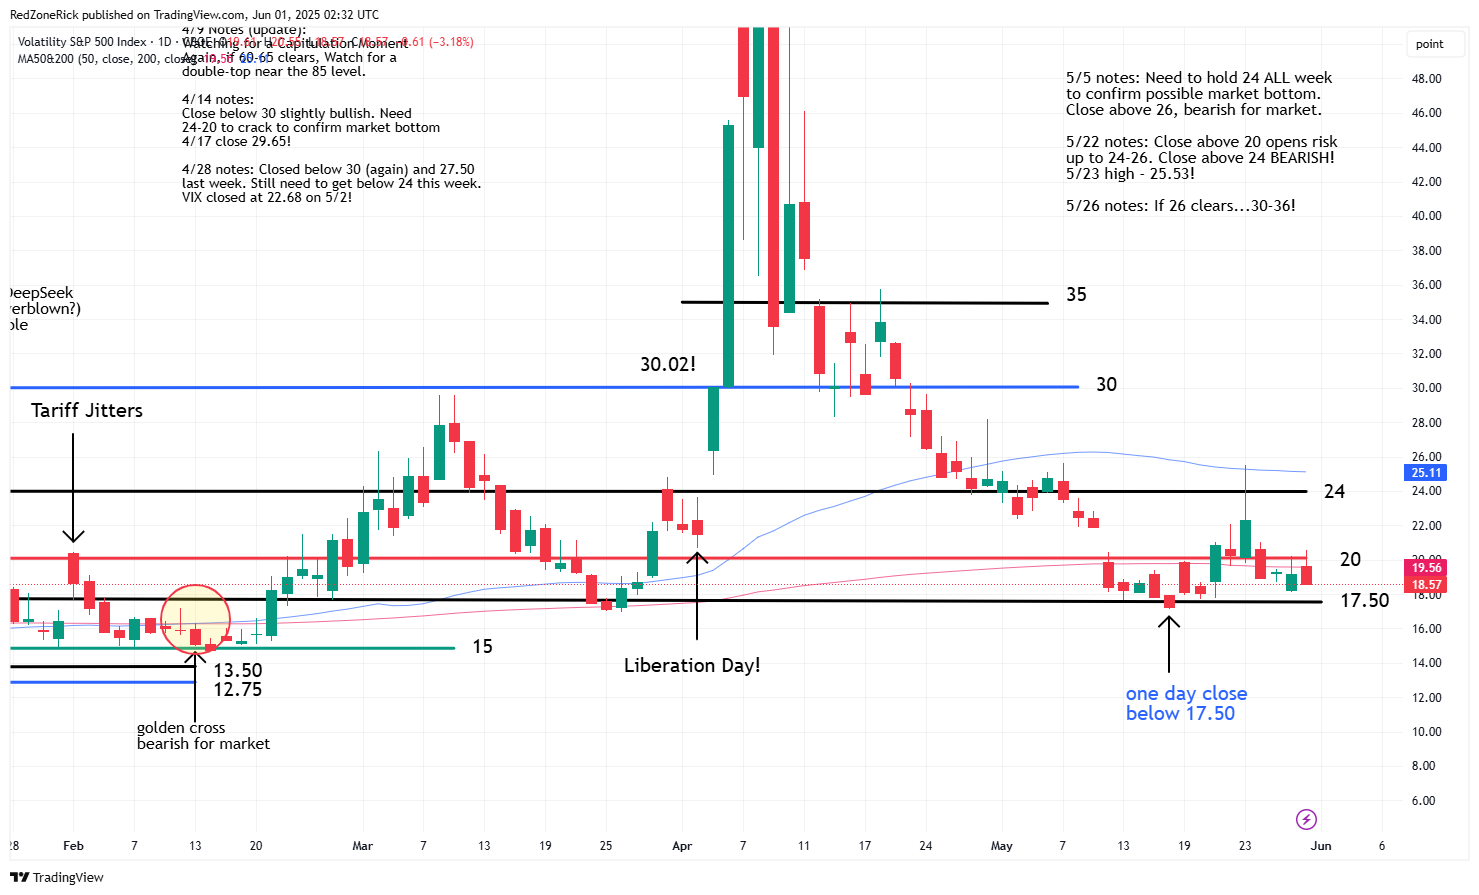
The second quarter earnings season starts in early July and until then, economic and geopolitical news, will likely drive price action. We have warned a close above 24-26 on the Volatility Index (VIX) would be bearish for the market while closes below 17.50 would be bullish for the major indexes.
Aside from the VIX, we are also watching major support and resistance levels for the major indexes like a hawk. Additionally, we also like to track the Dow Jones Transportation Average (DJT) as the index can sometimes offer important clues on how the Dow Jones might trade.
The Dow Transports often act as a leading or confirming indicator for the Dow and the broader market, in general. If you’re seeing divergences between the Dow and Dow Transports, it’s worth doing further research as it might signal a turning point or loss of momentum.
This theory, or relationship, between the blue-chips and the transports is rooted in a century-old principle known as Dow Theory, which remains influential among technical analysts. Historically, the Dow Theory suggests the stock market is in an uptrend if both the Dow Jones Industrials Average and the Transports are making higher highs. These factors would also confirm a possible bull market or economic strength.
A deeper dive into Dow theory also suggests that if the Dow is rising but the Transports are lagging or falling, this could signal bearish divergence and cracks in the economy. If the Transports break sharply lower it could be a warning signal that the Dow may follow its lead shortly afterwards. And finally, if the Transports are leading the Dow higher, this is a bullish signal and means demand and growth could be picking up.
With this being said, Dow Theory is not a timing tool, and is better used for possible trend confirmation. In other words, this analysis is more reliable over weeks and months, not day-to-day. The Transport stocks are and heavily tied to economic trends like fuel prices, e-commerce volume, and supply chains.
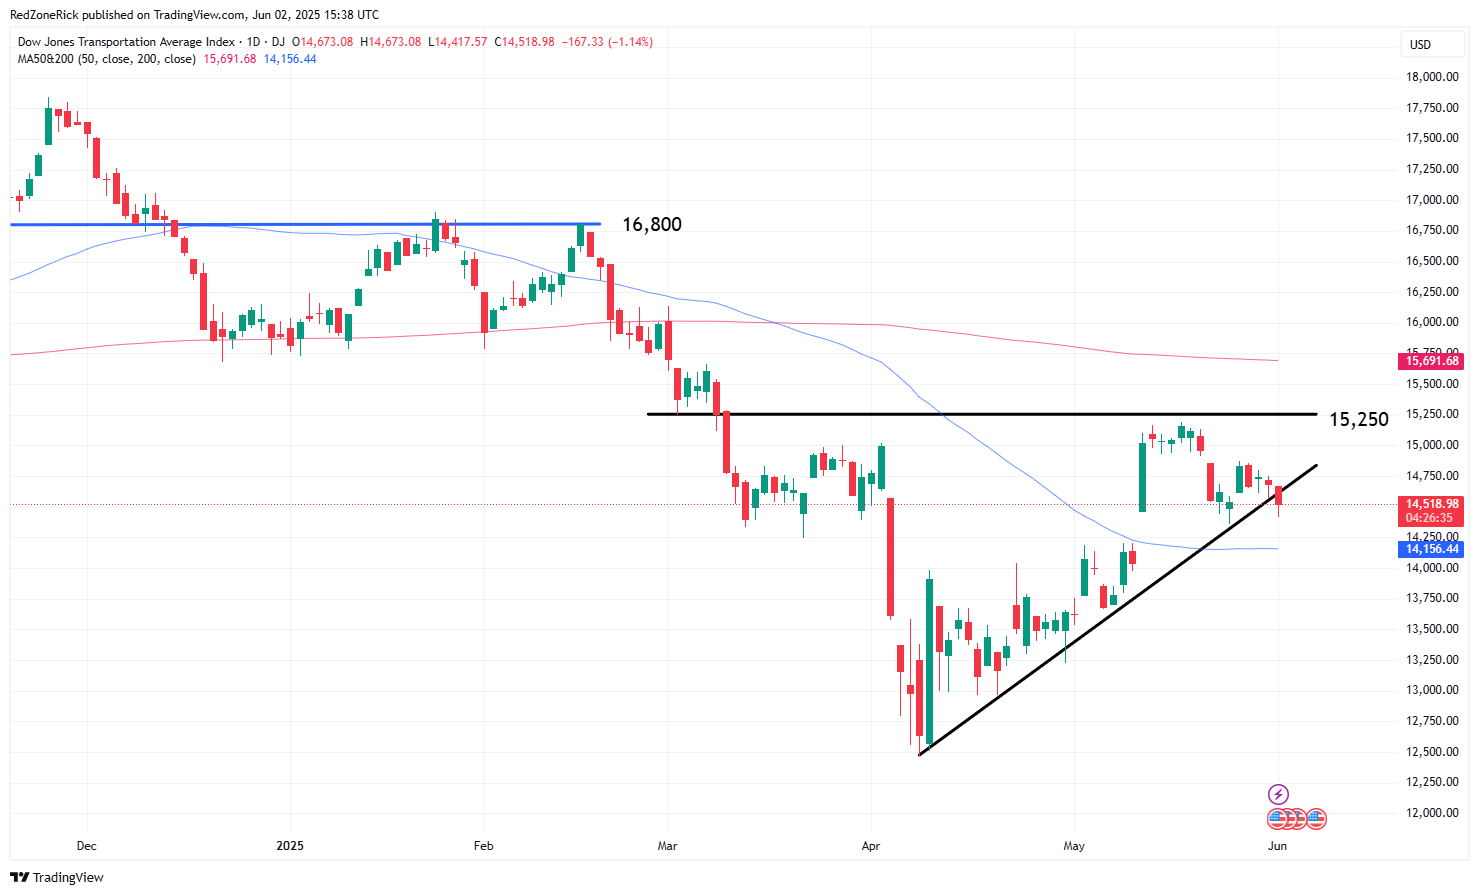
As far as the charts for both, let’s take a look at the Dow Jones Transportation Index (DJT), first. The May 12th breakout above the 50-day moving average was a bullish development but fell shy of key resistance at 15,250. A six-session trading range followed before a pullback towards the 50-day moving average. The recent action is still holding an uptrend line with resistance at 15,250 forming an ascending triangle. This is typically a bullish setup for a breakout, or higher highs, if cleared and held.
A drop below 14,500-14,250 and out of this technical formation would be a bearish development. Closes below the latter would likely confirm a near-term top for the Transports and possibly the overall market.
There are 20 companies in DJT that include the major airlines (Delta, American), railroads (Union Pacific, CSX), trucking (J.B. Hunt, Old Dominion), and shipping and logistics (FedEx, UPS). It can also helpful to check the price action in some of these individual stocks to confirm price action.
As far as the Dow, key resistance levels are at 42,400 and the 200-day moving average followed by 42,800. Support is at 41,000 and the 50-day moving average.
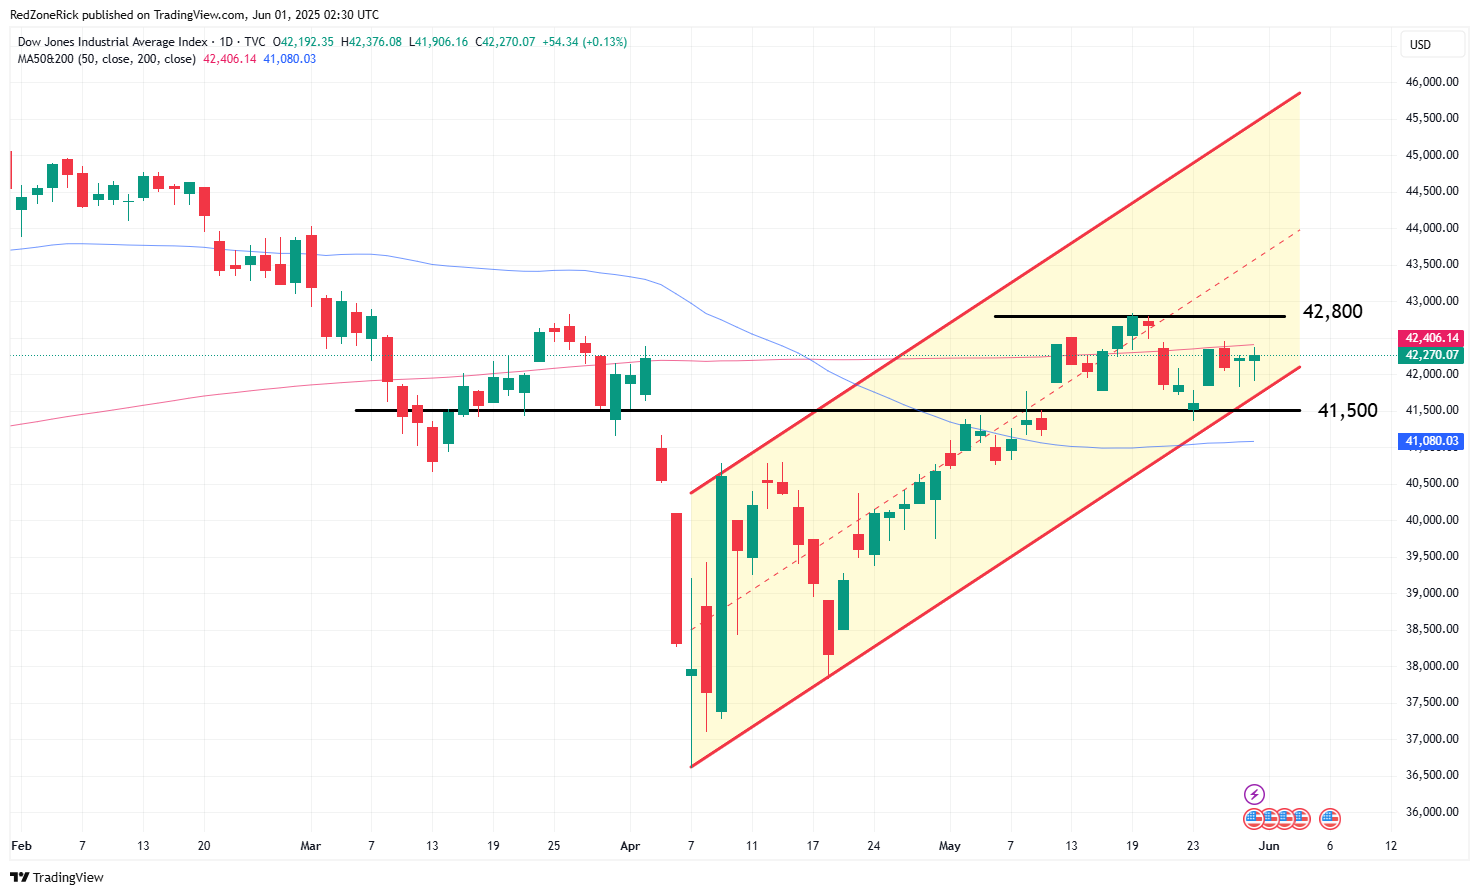
In summary, watch for multiple closes above 15,250 on the Dow Jones Transportation Index, then 42,400 and 42,800 for the Dow. If all of these levels are cleared and held, a summer rally could be in store for the stock market.
Closes below 14,250 on the Dow Jones Transportation Index and closes below 41,000 and the 50-day moving average on the Dow could be bearish developments for the stock market.
As far as trading the Transports, the S&P Transportation Index (XTN) is also showing an ascending triangle pattern with a possible breakout occurring on continued closes above $80. The next waves of resistance would be at $82 and 200-day moving average followed by $84. A close below support at $74 and the 50-day moving average would suggest a near-term top.