Weak Jobs Report Stalls Market Momentum
- For the week, the Nasdaq fell 2.9% and the S&P stumbled 2.4%. The Dow was down 2.9% while the Russell sank 4.1%. Year-to-date, the Nasdaq has gained 6.9% and the S&P has added 6.1%. The Dow is higher by 2.5% but the small-caps are now negative as the Russell has dropped about 3% for 2025.
- The (RSI) relative strength index levels for the Nasdaq and the S&P had been in overbought territory (70 and above) since late June and more so in mid-July. Friday’s plunge pushed the Nasdaq back towards 50. The S&P’s RSI reading closed just below this level at 48. The 50 area is typically a neutral reading and 30 represents oversold territory for a stock or index.
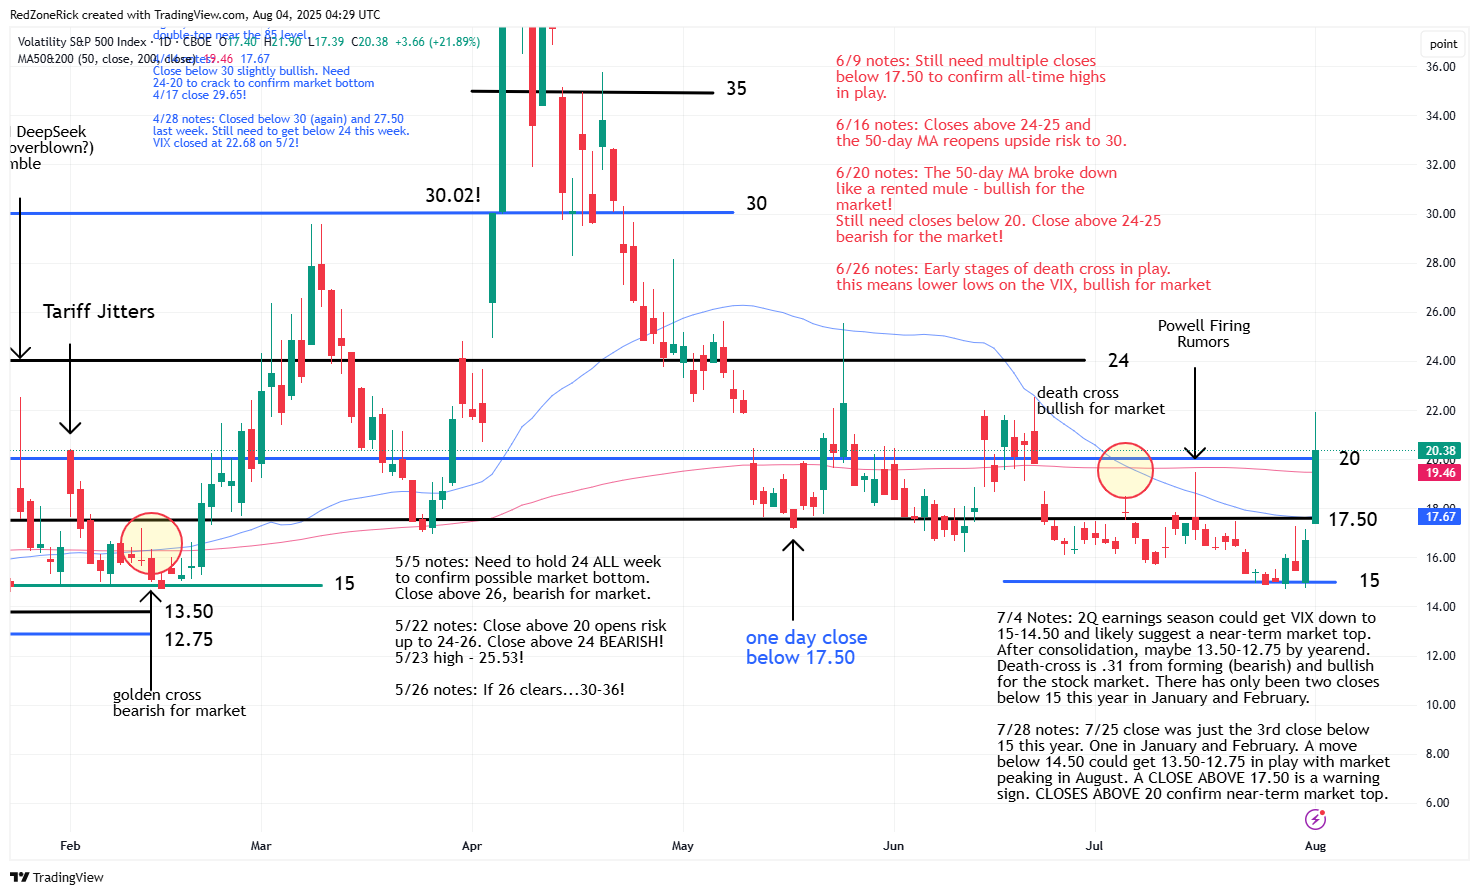
- Coming into last Monday, we mentioned a close above the first wave of resistance at 17.50 for the VIX was a yellow light for the market and that the second wave at 20 would be a bearish development. That scenario played out in one session and now opens up stretch up to 24.
A weaker-than-expected jobs report surprised Wall Street on Friday as growth totaled a seasonally adjusted 73,000 for the month. Expectations were for a gain of 100,000 jobs.
The news gave the bears the weekly win but helped alleviate some of the overbought conditions for the major indexes. Volatility also spiked to signal a possible near-term market top with the blue-chips and the small-caps falling below key support levels.
The Nasdaq closed at 20,650 (-2.2%) after testing a low of 20,560. Key support at 20,500 held. Resistance is at 21,000.
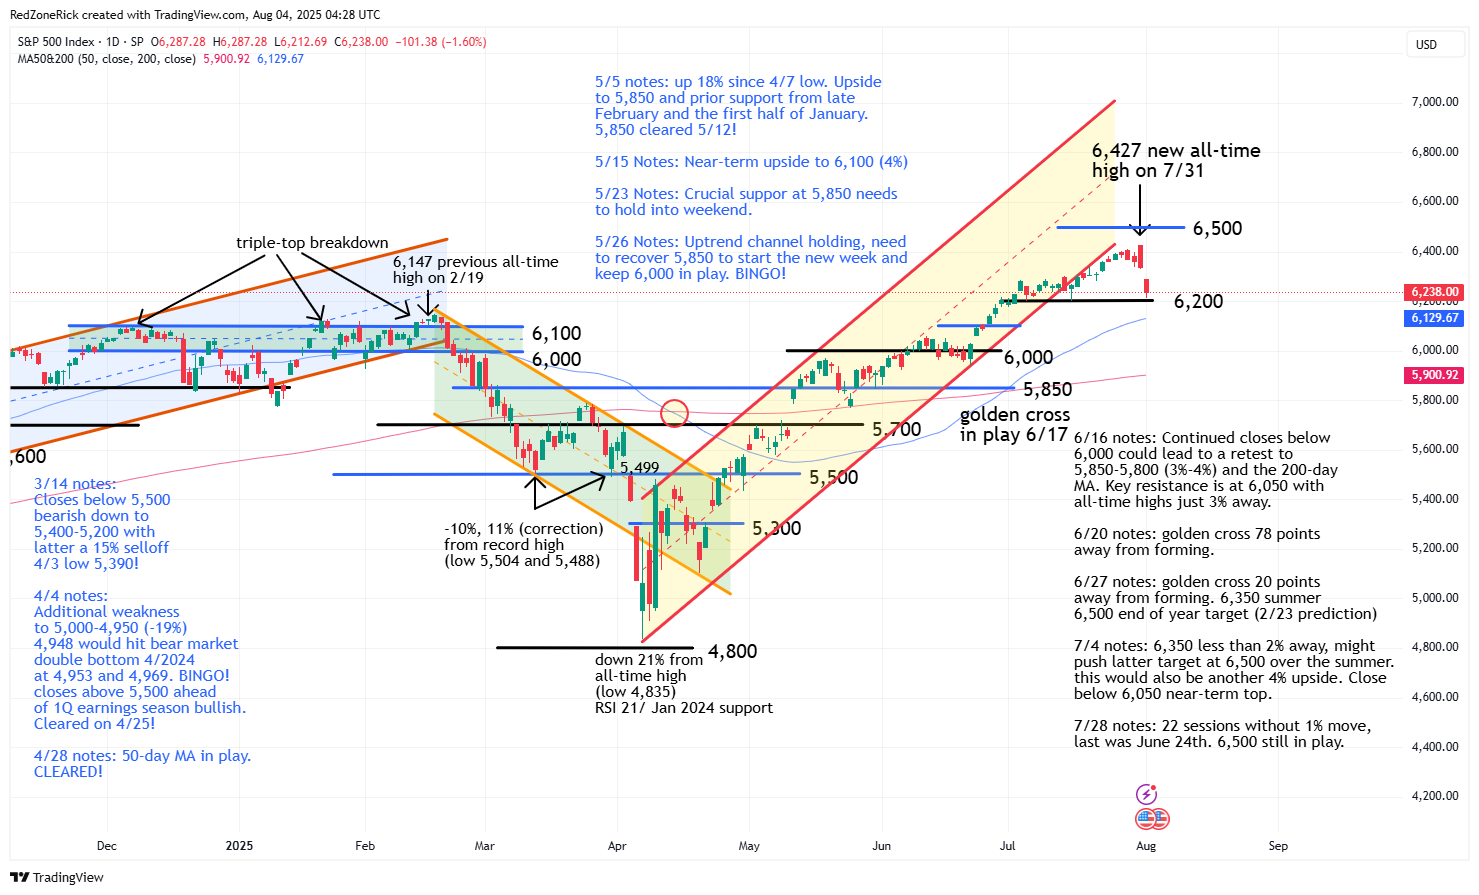
The S&P 500 tapped a low of 6,212 before ending at 6,238 (-1.6%). Fresh support at 6,200 held. Resistance is at 6,300.
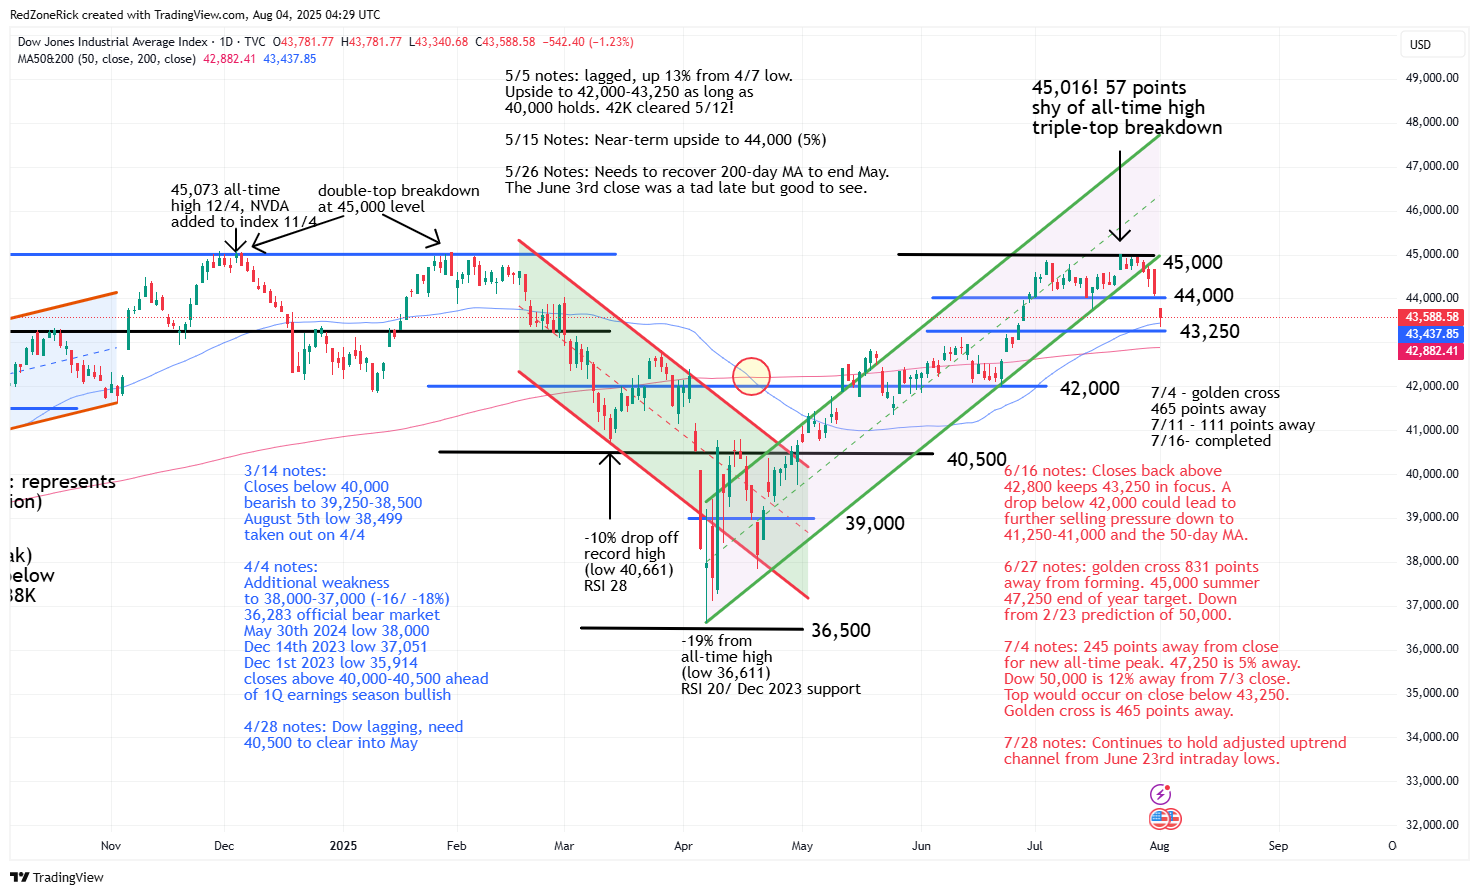
The Dow went out at 43,588 (-1.2%) with the intraday low hitting 43,340. Prior support at 43,500 was cracked but held. Resistance is at 44,000.
Earnings and Economic News
Before the open: Berkshire Hathaway (BRK.B), onsemi (ON), TG Therapeutics (TGTX), Wayfair (W)
After the close: Diamond Energy (FANG), Palantir Technologies (PLTR), Hims & Hers Health (HIMS), Lattice Semiconductor (LSCC), Transocean (RIG)
Economic News
Factory Orders – 10:00am
Technical Outlook and Market Thoughts
For the week, the Nasdaq fell 2.9% and the S&P stumbled 2.4%. The Dow was down 2.9% while the Russell sank 4.1%. Year-to-date, the Nasdaq has gained 6.9% and the S&P has added 6.1%. The Dow is higher by 2.5% but the small-caps are now negative as the Russell has dropped about 3% for 2025.
The (RSI) relative strength index levels for the Nasdaq and the S&P had been in overbought territory (70 and above) since late June and more so in mid-July. Friday’s plunge pushed the Nasdaq back towards 50. The S&P’s RSI reading closed just below this level at 48. The 50 area is typically a neutral reading and 30 represents oversold territory for a stock or index.
The RSI levels for the Dow and the Russell are at 42 and 41, respectively, after failing to regain 70 in mid-July and are easily pointing towards a test to 30. It is important to note that RSI levels can fall below this level and into the low 20’s and teens for weeks and months to remain extremely oversold as selling pressure picks up steam. We wanted to point this out because the major indexes just went through overbought levels for much of the summer.
We don’t think oversold levels will be in play for long, if they do come into play, as there is a pile of cash on the sidelines waiting to be deployed…especially from investors and traders that might have missed the v-shape recovery off the early April lows. However, we will just have to wait-and-see approach on how the next few weeks unfold. While we can take a possible bow for calling a near-term market top, every trading environment is different.
The Nasdaq tested an all-time high of 21,457 on Thursday and came within 43 points of tagging our summertime target at 21,500. Our January 22nd target prediction for the Nasdaq was at 22,000 by yearend and on July 4th we said there was still 4% upside to 21,500.
Crucial support from the first half of July is at 20,500. A close below this level will likely lead to further weakness down to 20,100-20,000 and the 50-day moving average. We also said on July 4th, a close below 20,000 would suggest a near-term top for the index. The Nasdaq went 19 sessions without a 1% change before Friday’s setback. 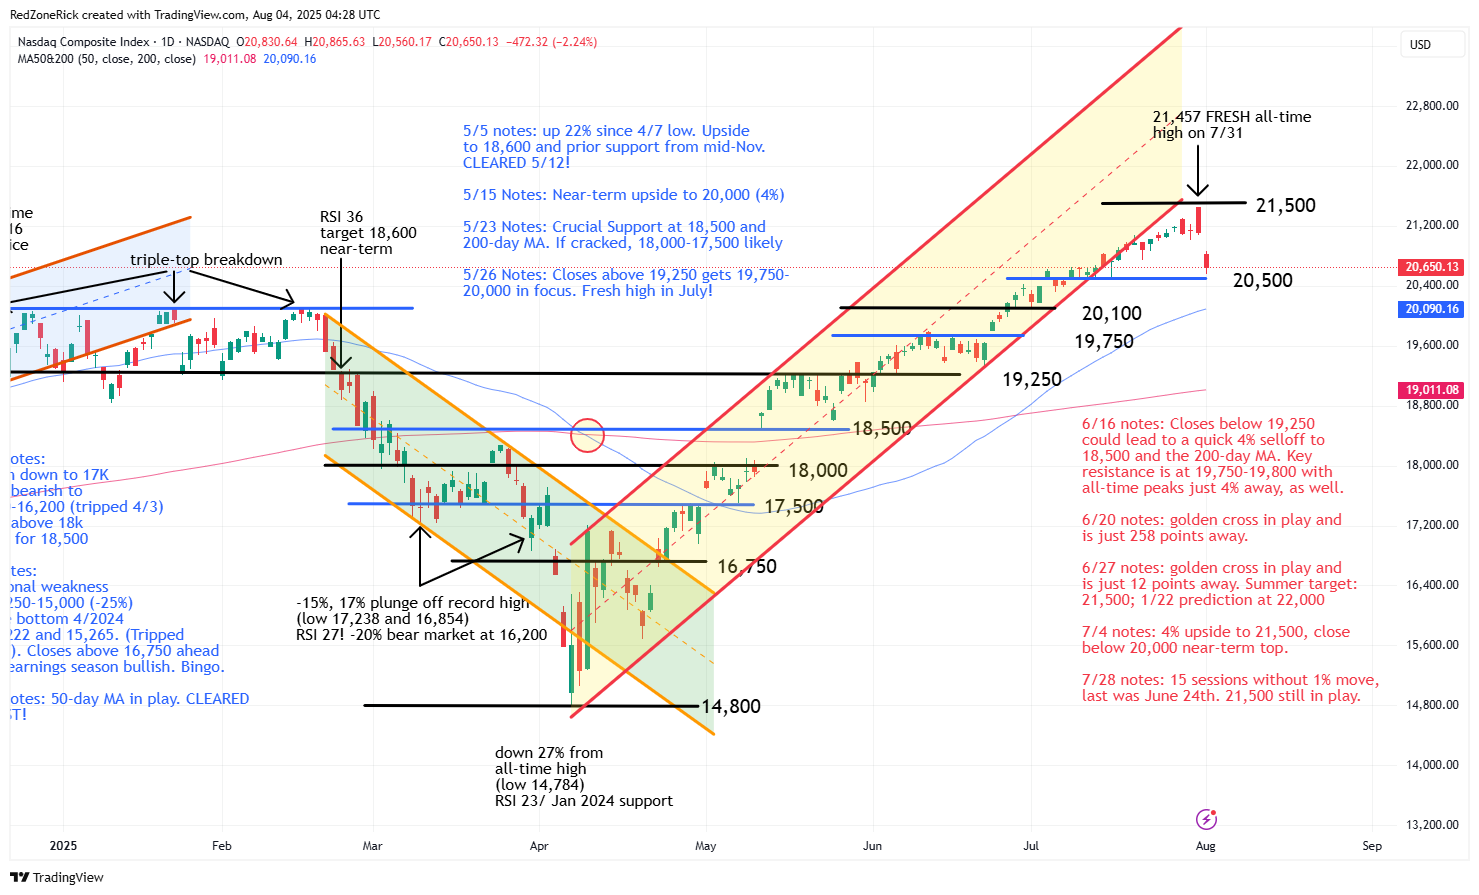
The S&P 500 tagged a record peak of 6,427 to close out July while splitting our near-term price-targets at 6,350-6,500 for the index. These levels were 25% and 28% higher from our February 23rd price prediction for the index. We still think the latter can trip at some point this year.
Key support at 6,200 held on Friday’s drubbing and represented the first 1% move in the index since June 24th, or 26 trading sessions. A close below this level would be an ongoing bearish development with further risk down to 6,100 and the 50-day moving average.
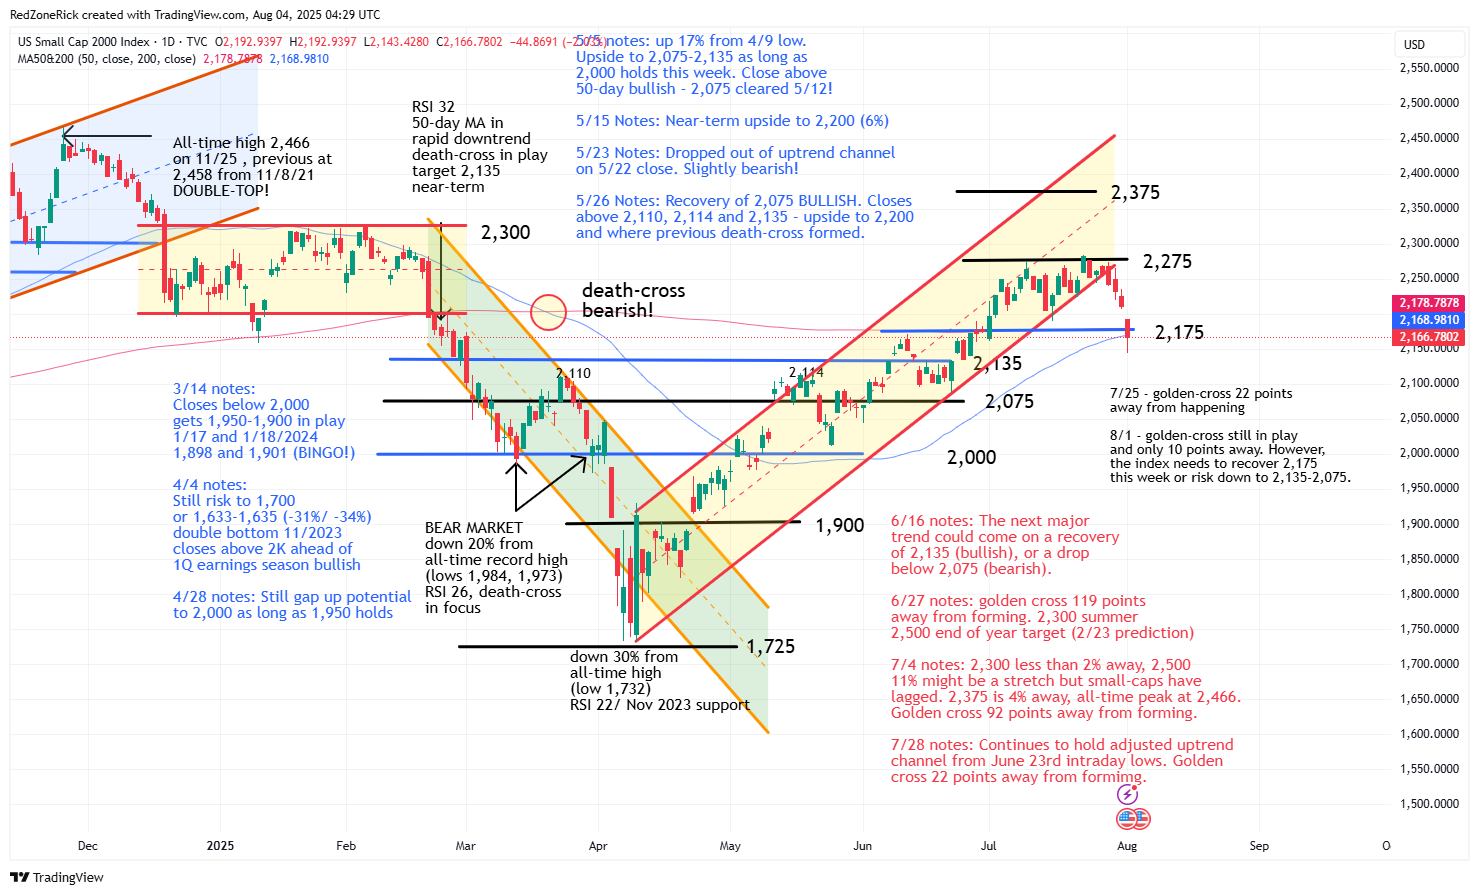
The Russell 2000 tested a high of 2,270 and 2,273 to start last week but failed key resistance at 2,275. The previous week’s high and close at 2,283 was a tease that failed to hold and why we always say to confirm price action. A golden cross is still just 10 points away but the index needs to recover 2,175 this week to keep this bullish technical setup in play.
The breakdown out of the uptrend channel last Tuesday reached an intraday low of 2,143 on Friday. The close below key support at 2,175 and the 200-day and 50-day moving averages could indicate a further fade down to 2,135-2,075.
The Dow made five attempts to clear and hold key resistance at 45,000 with the July 23rd close at 45,010 also giving the bulls a one-day tease. On June 27th, we lowered our Dow 50,000 price target from February 23rd to 45,000 for the summer and possibly 47,250 if this level is recovered to close out 2025. If this is a near-term top, you can’t call it much more precise than that.
Last Wednesday’s freshly formed “triple-top” breakdown out of the uptrend channel lead to a quick elevator drop to backup support at 43,250. Friday’s gap below 44,000 and a key level we said to watch into last week is now resistance. A close below 43,250 and the 50-day moving average would imply additional weakness down to 43,000-42,750 and the 200-day moving average and likely confirm a near-term peak for the blue-chips.
The Volatility Index (VIX) closed back above 15 last Monday and was the first warning signal it could be a rocky week. On July 4th, we predicted weakness down to 15-14.50 during earnings season with the market peaking at some point in August. The VIX tagged 14.70 last Tuesday and 14.74 last Thursday to split our near-term target while the Nasdaq and S&P 500 set record highs while pulling back on Friday.
Coming into last Monday, we mentioned a close above the first wave of resistance at 17.50 for the VIX was a yellow light for the market and that the second wave at 20 would be a bearish development. That scenario played out in one session and now opens up stretch up to 24. This is important so keep this in mind over this week, if 24 clears, there could be extreme selling pressure in the market with risk up to 30 for the VIX.
We said the VIX would make it fairly simple to figure out when the bears would start to attack the market and this week’s goals for the bulls will be to get a close back below 20, first, and then 17.50.
Coming into last week, we also highlighted the July 16th intraday support levels at Nasdaq 20,500; S&P 6,200; Dow 44,000 and Russell 2,175. We mentioned as long as these levels held we would remain bullish. With the Dow and Russell closing below these levels, we are officially neutral and on the edge of turning bearish on the market.
If the Dow and the Russell can recover 44,000 and 2,175-2,200 then Friday could just be a hiccup from the stealth rally off the early April lows. If not, and the Nasdaq and the S&P take out their aforementioned support targets, the bears could get aggressive. Remember, you can do just as well trading a bearish market as you can a bullish market. We always say we really don’t care about market direction, we just like to trade the trend.